-
Introduction [Link]
-
- What is the Water Balance Model? [Link]
-
The Water Balance Model is a decision support tool developed to help local governments achieve desired urban stream health and environmental protection outcomes. Available in the public domain and accessible online (at www.waterbalance.ca), the Water Balance Model puts the power to run detailed hydrology simulations and comparisons into the hands of anyone with an internet connection.
The value of the tool lies in its ability to graph and report the differences between pre-development, post-development and mitigation scenarios for the modeled area. In addition to the ability to model small (site), medium (development) and large (watershed) land masses, the simulation is performed with historically accurate climate data that spans a multi-decade period, recorded in hourly time steps.
-
- How to Use this Manual [Link]
-
The Water Balance Model Technical Manual is structured to meet the information needs of technical audiences and provides technical descriptions of methods and formats used to gather inputs, transfer those inputs to the QUALHYMO modeling engine and display results within the Water Balance Model application. This description doesn't cover the use of the Water Balance Model user interface or the QUALHYMO modeling engine; these are described in separate user's guide documents. This documentation focuses on the data structure, data values, transfer procedures and relevant equations and procedures used to calculate results for graphing and reporting of different user scenarios.
The Guidebook is structured in four main parts:
Part A – Data Inputs: A description of different data input options presented in the User Interface of the Water Balance Model and any interim calculations that are triggered by, or required to facilitate their processing. This includes details of value type, value ranges, units, related values or equations and data requirements.
Part B – Mapping Data to QUALHYMO: An explanation of how gathered data inputs into the model are translated into the input file that QUALHYMO requires. This portion is split into two parts; the first covers the organization of QUALHYMO's commands, and the second maps how each command relates to the data input.
Part C – Graphic Outputs: Details of the three graphic outputs of the Water Balance Model and printable reporting features.
Part D – Equation and Data References: Additional information regarding the various equations, external weather data and user restrictions involved in the Water Balance Model.
This guide also includes references to equation sources, a glossary of terms and navigable index to allow for easy navigation.
The technical manual draws on existing documentation developed for the current Users Guide and the QUALHYMO model. Illustrations are provided for additional explanation and context. The overall objective of this manual is to offer an effective and useable approach to explaining the data and procedures that make up the Water Balance Model.
-
-
About the Manual [Link]
-
- Preamble [Link]
-
There are a couple of key concepts that should be covered before attempting to understand the inner workings of the system. The Water Balance Model is built on HB Lanarc's Universal Calculator technology platform. The heart of the system is a visual user interface developed with the Adobe Flex SDK and published to a set of Adobe Flash Player files that interface with a database through web services to store the entered and calculated data as XML. In the case of the Water Balance Model powered by QUALHYMO, there is a system to manage the translation of the entered data into QUALHYMO's input file syntax.
This portion of the technical manual is ordered chronologically; each step of the process is listed in the order it appears to both the user and, in the portions that happen away from the user interface, the order that the software processes and prepares the final results.
-
- Technical Considerations [Link]
-
As a computer-based computational model, the technologies used throughout have an effect on how values are stored and processed. The values entered in the User Interface are stored and transfered throughout the model without any alteration of the original value unless combined with others in some form of equation. The model uses 32 bit floating-point binary format for storing and representing numbers. Numbers are in general represented to a fixed number of significant digits and scaled using an exponent. The typical number that can be represented exactly is of the form:
significant digits × base exponent
Rounding is used by the binary format when the exact result of a floating-point operation would need more digits than there are digits in the significand. There are several different rounding schemes, but since the introduction of the IEEE 754 standard for floating-point representation, the default method (round to nearest) is most commonly used. As floating-point numbers cannot precisely represent all real numbers, and that floating-point operations cannot precisely represent true arithmetic operations, some very insignificant rounding errors may be introduced into the values entered and processed for use by QUALHYMO due to the limit of precision inherent in computer based mathematics.
Rounding or truncating of values appears when graphically representing values in the text portion of error messages or 'Tool Tips'. It also occurs when reporting ouput values in the summary graphs and reports. This does not represent an actual alteration of the stored value, but done for the ease of reading by the user. The full value remains stored in the scenario as entered or processed. The following table details the precision of output values for reporting variables.
Value Precision Example Exceedance Summary (Duration) 0/10 Duration: 6735 hours Exceedance Summary (Rate) 1/10 Rate: 10.4 m³/s Volume Summary (Total Rainfall) 2/10 2373.55 million m³ Volume Summary (Volume) 1/10 Volume: 846.1 million m³ Volume Summary (Percent of Total) 1/10 Percent of Total: 35.6% Erosion Summary (Variation) 1/10 Variation: 21.9% Unless otherwise noted elsewhere, specific implementations of the following data types are used:
-
Numbers
In the user interface, numbers are entered as literal strings, and converted to IEEE-754 double-precision floating-point numbers for use in equations. These values are stored as a string representation of XML node values in the database.
During pre-processing of the scenario data, numbers are cast from the stored strings back to double-precision floating-point numbers. Depending on the exact requirements of each parameter for QUALHYMO, certain values are rounded as required to the nearest integer, or number of decimal places. See QUALHYMO User Manual for details.
-
Dates
Recorded in the MM/DD/YYYY format (e.g. 31/12/2005).
-
Time
Recorded in the HH/MM/SS format (e.g. 11/27/08).
-
Text
In the user interface, text is entered as literal strings. These values are stored as a string representation of XML node values in the database.
-
-
-
Data Inputs [Link]
-
- Water Balance Model powered by QUALHYMO [Link]
-
The Water Balance Model powered by QUALHYMO is a model built on a variety of related interface and calculations engine components that interact and handle user input data to allow for reliable results and ease of use. The QUALHYMO model is the hydrologic calculation engine that provides consistent delivery of results while the web-based decision support interface manages data so that users and reviewers can compare multiple development and land use scenarios. The significant benefit of the Water Balance Model is the resulting emphasis on strategy and alternative implementation methodologies, as well as the focus on a multitude of design details available to achieve the desired objectives.
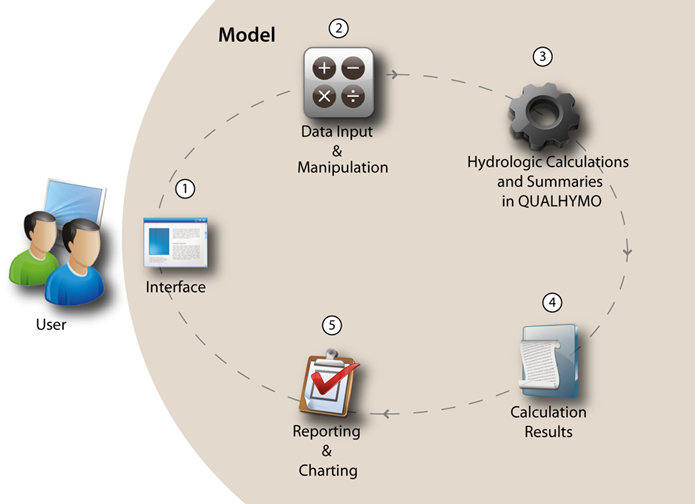
The graphic above illustrates the relationship of the five distinct components that comprise the Water Balance Model powered by QUALHYMO. From an outside view, the functions of each component can be described in simple terms as follows:
The User Interface (going in):
This allows the user to communicate with the computer. This is where the data go in and the results come out. This component is composed of a series of screens that allow data entry, and a series of standard results output pages.
Input Data and Manipulation:
The data that are entered are then processed. This component encompasses calculations of time of concentration (Tc), lumping of catchment data, calculation of source control operation based on user selection of type and physical description ( infiltration rates, discharge rates, storativity, etc); selection of discharges for the exceedance comparison; and most importantly, creation of the data file that QUALHYMO needs.
QUALHYMO Hydrologic Calculation Engine:
Next, the engine does the hydrologic and routing calculations at the site, development or watershed level; and provides the summary of discharges for flow magnitude, volumes and exceedance.
Calculation Results:
This component performs the function of extracting the results from the QUALHYMO model. It runs and sorts them for comparison of the various scenarios for a project. It also performs the calculation for the stream power and potential erosion outputs. While this may in future be built into QUALHYMO, it is now done by the Water Balance Model.
Reporting and Charting:
After the calculation and extraction processes are completed, this portion of the system takes all of the numerical results and provides the graphical and tabular results summaries for the project and the scenario comparisons.
The User Interface (coming out):
Finally, the interface displays the charts and tables to the user and allows them to be extracted for reporting.
-
- Mapping the Relationship Between the Interface and the Data [Link]
-
With few exceptions, each and every window or data input form is simply a tool for filling out an XML representation of your project. The relationship between the entry forms and the underlying data schema is very tight; for the most part, what is entered is what is recorded. This section allows the user to understand how changes made in the interface will end up influencing the input file prepared for QUALHYMO.
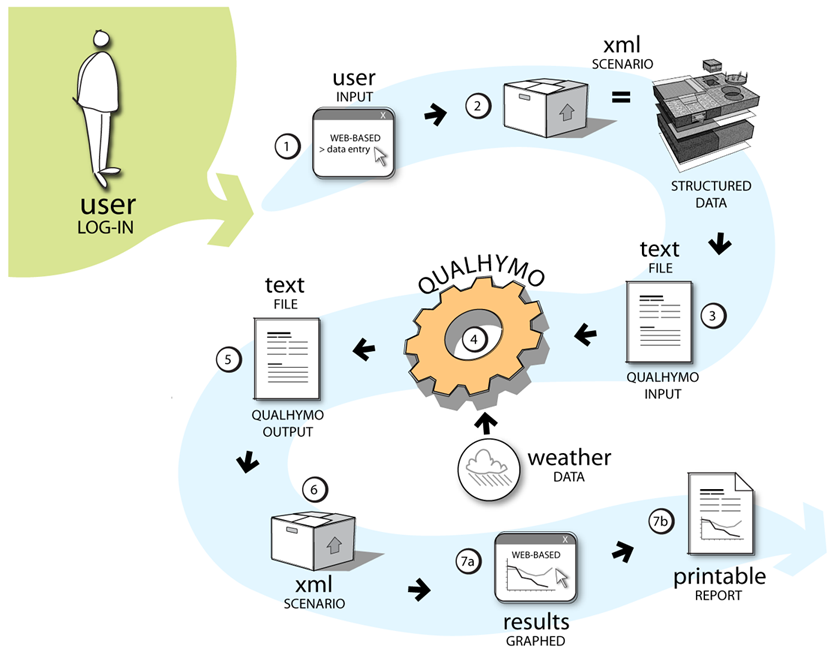
The above illustration represents an overview of the flow of data inputs, their conceptual and format transformations, their relationships to other data and model components, and the resulting outputs. It serves as a 'roadmap' to the data value mapping detail presented in the following section.
-
- Variable Relationship Mapping [Link]
-
One of the substantial benefits of the Water Balance Model powered by QUALHYMO is it's ability to graphically create project scenario comparisons and leverage the power of the QUALHYMO input files without the ancillary data handling and calculations normally required. But how do the values the user enters into the interface route themselves through the Water Balance Model system into QUALHYMO and back out to the interface in the form of results?
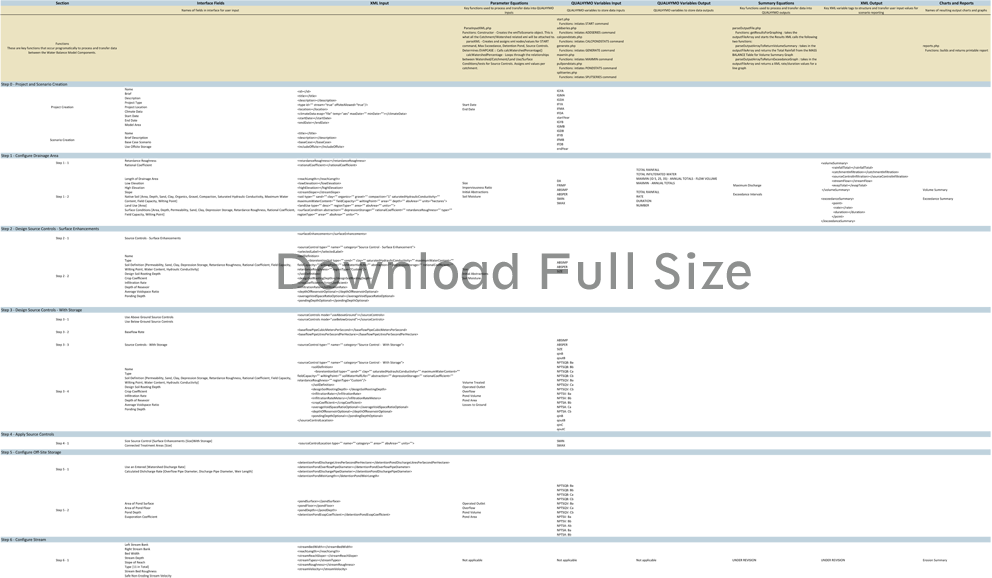
The following table describes a more detailed mapping of relationships between key inputs, variables, functions and outputs as they pass between the various components of the Water Balance Model system.
The main components of the system are listed below and are easily related to those used in the previous diagram.-
Interface Fields
-
XML Input
-
Parameter Equations
-
QUALHYMO Variable Inputs/Outputs
-
XML Output
-
Charts and Reports
Click on the thumbnail below to download a table that describes the relationship between key inputs, variables, functions and outputs as they pass between the various components of the Water Balance Model.
-
-
- Projects & Scenarios [Link]
-
Sub-sections:
The primary system organizational structure in a calculator such as the Water balance Model, is a two-tiered organization structure for your ‘files’; in this case, they are organized into Projects and Scenarios. Projects capture the details that will remain constant throughout all of the modelled scenarios.
-
- Create a New Project [Link]
-
Values defined at the project level are shared by all scenarios within the project.
Inputs for Project Configuration
Field Affects Type Value Units Required? Description Project Type String Site, Development, Development w/Stream or Watershed n/a Required Determines the availability of optional features within the project's scenarios (stream erosion, off-site storage) and the command configuration used by QUALHYMO. Climate Data String Abbotsford, Calgary, Comox, Edmonton, Halifax, Kamloops, Kelowna, Kwatlen, Langley, North Vancouver, Ottawa, Surrey, Toronto, Vancouver, Victoria, White Rock, Winnipeg n/a These are the Climate Data Sets available to the model. Start Date Start Date String ≥ first available day of climate data MM/DD/YYYY Defines the first and last records that will be used from the selected Climate Data during the processing of each scenario. End Date End Date ≤ last available day of climate data Model Area Float > 0 Hectares, Acres or Sq. Metres; The size of the area modelled.
-
- Create a New Scenario [Link]
-
Each project may have one or more scenarios for reporting and comparing purposes.
Inputs for Scenario Configuration
Field Affects Type Value Units Required? Description Use Off-Site Storage? String Yes or No n/a Required if the Project Type is Development w/Stream or Watershed If set to Yes, the Configure Off-Site Storage inputs will be available. Base Case Scenario? String Yes or No n/a Required if a scenario has not already been designated as a Base Case. Normally, the first scenario in a project is designated as the Base Case scenario.
-
-
- Configure Drainage Area [Link]
-
Sub-sections:
Depending on the selected project type, either one or two drainage areas will be used. The various values and options in this step are tied directly to some of the parameters in QUALHYMO's GENERATE command.
-
- Define Values for Project Surface Conditions [Link]
-
Note: These values are only available in a base case scenario.
Typically, these values are calculated from the native soil types and surface conditions in the drainage area(s). The user also has the option to override them with custom values.
Custom Surface Values
Field Affects Type Value Units Required? Recommended Values Description Retardance Roughness Time of Concentration Float ≥ 0 Ratio Required 0.02 for smooth pavement
0.03 for poor grass, bare sod
0.08 for natural range
0.15 for short prairie grass
0.30 for dense lawn / sod
0.40 for woods
Defaults to 0.03Alter the quickness that surface runoff flows across the drainage area; calculation of the travel time of runoff for the base case scenario uses this value. Rational Coefficient Time of Concentration Float ≥ 0 Ratio Required 0.05-0.20 for sandy soil lawn
0.15-0.35 for heavy soil lawn
0.50-0.75 for single family residential
0.70-0.95 for downtown business
Defaults to 0.5Alter the quickness that surface runoff flows across the drainage area; calculation of the travel time of runoff for the base case scenario uses this value.
-
- Complete Descriptions of the Drainage Area(s) [Link]
-
Sub-sections:
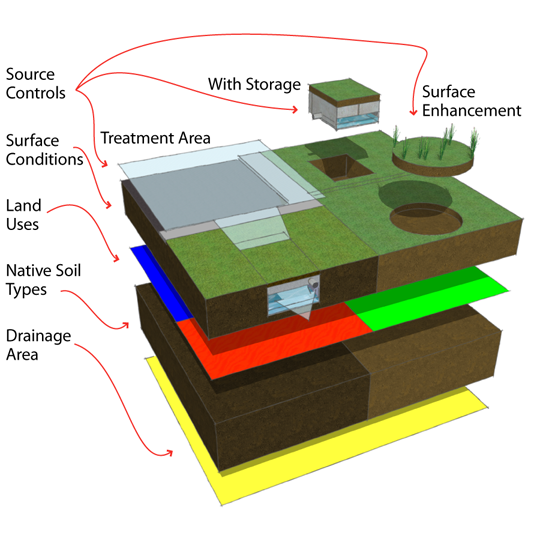
For clarity, the available inputs have been broken into several tables. The first table covers the inputs and values that apply to the drainage area as a whole, and the subsequent tables cover, in turn, the inputs available to each of the drainage area's ‘layers’ (native soil types, land uses and surface conditions).
Each of the layers of a drainage area consists of one or more ‘nodes’ representing specific physical or administrative characteristics of the project.
This section covers all of the inputs available for the drainage area, native soil types, land uses and surface conditions nodes; the inputs for individual source controls (surface enhancements, or with storage) and how they interact with the drainage area are each located in separate sections.
The figure below is a modeled image of a drainage area which displays the components that users define during the configuration of scenario. It serves as a framework to understand the relationship of the drainage area parameter details to follow.
-
- Basic Parameters [Link]
-
Each drainage area in a scenario (one, except in the case of watershed project types) has some basic parameters that control the overall size and slope.
Inputs for Basic Drainage Area Parameters
Field Affects Type Value Units Required? Description Drainage Area: Size
(As an Area)Drainage Area: Size (As a Percent), Time of Concentration Float > 0 and ≤ the parent Model Area node, unless the Project Type is a watershed, this it must equal > 0 and < the parent Model Area node Hectares, Acres or Sq. Metres; Required This is the actual area of the site or development property. Drainage Area: Size
(As a Percent)Drainage Area: Size (As an Area), Retardance Roughness, Rational Coefficient, Soil Moisture Float 100, unless the Project Type is a watershed, then it must equal: > 0 and < 100, with the total from both drainage areas = 100 Percent Required This Percent identifies how much of the total watershed is represented by the study area or project worksite. Length of Drainage Area Time of Concentration, Slope Float > 0 Metres Required The path that a raindrop would follow if it were to runoff from the highest point of the study area; it follows the fall line and is perpendicular to the contour lines of equal elevation. High Elevation Slope Float > 0 Metres Optional The elevation of the highest point of land in the study area. Establishing an elevation for the highest point of land within a drainage area enables the slope of the land to be automatically calculated. Low Elevation Slope Float > 0 Metres Optional The elevation of the point where surface runoff would leave the drainage area. Establishing an elevation for the lowest point of land within a drainage area enables the slope of the land to be automatically calculated. Slope Time of Concentration Float > 0 Metres⁄Metres Required The elevation difference from the high point to the low point divided by the length of the drainage area. The Water Balance Model may also use the high and low elevation values entered by the user to calculate this number.
-
- Native Soil Types [Link]
-
With the basic values of a drainage area entered, a hierarchy representing the composition of soils and surfaces can now be assembled. Working from the ‘bottom up’, the size and placement of each native soil type is entered first.
Inputs for Native Soil Types
Field Affects Type Value Units Required? Description Native Soil Types: Size
(As an Area)Native Soil Types: Size (As a Percent) Float > 0 and ≤ the parent Drainage Area: Size (As an Area) node Hectares, Acres or Sq. Metres; Required Native Soil Types: Size
(As a Percent)Native Soil Types: Size (As an Area), Retardance Roughness, Rational Coefficient, Soil Moisture > 0, and all native soil types in a drainage area must add up to 100% Percent Native Soil Types: Depth Soil Moisture Float > 0 Millimetres Required Native Soil Types: Wilting Point Float ≥ 0 and ≤ 100 Percent Required Native Soil Types: Field Capacity Float ≥ 0 and ≤ 100 Percent Required Each node within the native soil types layer of a drainage area may have a separate set of soil conditions specified. These are the basic building blocks for some of the properties of the QUALHYMO GENERATE command.
Inputs for Native Soil Types Soil Conditions
Field Affects Type Value Units Required? Recommended Values Description Soil Type:
SandWilting Point, Field Capacity Integer ≥ 0 and ≤ 100, and the total sand and clay must be ≤ 100 Percent Required Heavy Clay, Silty Clay, Clay, Sandy Clay, Silty Clay Loam, Clay Loam, Sandy Clay Loam, Silty Loam, Loam, Silt, Sandy Loam, Loamy Sand and Sand Review the soil texture triangle to find the specific sand/clay breakdown that is present in each of the soil types. Soil Type:
ClayOrganics
% by WeightFloat ≥ 0.0 and ≤ 8.0 Percent Required n/a Gravel
% by WeightFloat ≥ 0.0 and ≤ 50.0 Percent Required n/a Compaction Float ≥ 0.9 and ≤ 1.9 Co-efficient Required 0.9 Loose
1.0 Normal
1.1 Dense
1.2 Hard
1.3 Severe
-
- Land Uses [Link]
-
The local municipality, generally through by-laws and zoning standards, describes land uses. In practical terms, the only affect of a land use is that it is a container for one or more surface conditions (and, by extension, one or more source controls).
Inputs for Land Uses
Field Affects Type Value Units Required? Description Land Uses: Size
(As an Area)Land Uses: Size (As a Percent) Float > 0 and ≤ the parent Native Soil Types: Size (As an Area) node Hectares, Acres or Sq. Metres; Required Land Uses: Size
(As a Percent)Land Uses: Size (As an Area), Soil Moisture > 0, and all land uses in a native soil types node must add up to 100% Percent
-
- Surface Conditions [Link]
-
The Surface Conditions describe physical characteristics of the study area.
Inputs for Surface Conditions
Field Affects Type Value Units Required? Description Surface Conditions: Size
(As an Area)Surface Conditions: Size (As a Percent) Float > 0 and ≤ the parent Land Uses: Size (As an Area) node Hectares, Acres or Sq. Metres; Required Surface Conditions: Size
(As a Percent)Surface Conditions: Size (As an Area), Soil Moisture > 0, and all surface conditions in a land uses node must add up to 100% Percent Surface Conditions: Depth Soil Moisture Float > 0 Millimetres Required if Permeability is Pervious Surface Conditions: Wilting Point Float ≥ 0 and ≤ 100 Percent Surface Conditions: Field Capacity Float ≥ 0 and ≤ 100 Percent Each node within the native soil types layer of a drainage area may have a separate set of soil conditions specified.
-
-
-
- Design Source Controls - Surface Enhancements [Link]
-
Several volume reduction methods (or ‘Low Impact Development’ facilities) can be assessed using altered catchment parameters describing the surface conditions of the catchment. These are also described as ‘Low Impact Development’ or LID facilities. Facilities aimed at capturing rainfall and reducing runoff consist of augmented or enhanced surface conditions that include:
-
increased top soil depth
-
soil porosity or moisture holding capacity
-
surface infiltration rates
-
vegetation and ground cover
-
imperviousness
-
surface roughness
Similarly, alterations of the surface conditions such as increased imperviousness can also be analyzed using these techniques.
Imperviousness is a surface enhancement (or alteration), whether positive or negative. One possible method of mitigating impacts is to reduce the value, hence an alteration in imperviousness can be a positive enhancement. A reduction can be as simple as reducing the area or by introducing pervious pavements.
Inputs for Design Source Controls - Surface Enhancements
Field Affects Type Value Units Required? Description Type String Absorbent Landscaping, Pervious Paving, Infiltration Swale - Without Underdrain, Rain Garden - Without Underdrain, Box Planter - Without Underdrain, Infiltration Trench n/a Required This identifies the type of source control - surface enhancement. Soil Definition String n/a Required except if Type is Infiltration Trench The soil definition selected for a source control - surface enhancement refers to a set of specific soil properties. Source Control - Surface Enhancements: Wilting Point Soil Moisture Float ≥ 0 and ≤ 100 Percent Required if Permeability is Pervious Source Control - Surface Enhancements: Field Capacity Float ≥ 0 and ≤ 100 Percent Source Control - Surface Enhancements: Maximum Water Content Float ≥ 0 and ≤ 100 Percent Design Soil Rooting Depth Float > 0 Millimetres Required except if Type is Infiltration Trench The rooting depth is generally the total depth of soil that would be available for moisture storage and root growth. Each plant has a growth pattern that may not take advantage of the entire depth that is available. Crop Coefficient Float ≥ 0 and ≤ 1 Ratio Required except if Type is Pervious Paving or Infiltration Trench The crop coefficient is simply a ratio of plant water demand to natural evaporation. Use 1.0 unless you have a more accurate estimate of the plants water consumption. Infiltration Rate (Per Hour) Float > 0 Millimetres⁄Hour Required if Type is Box Planter - Without Underdrain or Infiltration Trench The infiltration rate into the ground. Infiltration Rate (Per Second) Metres⁄Second Depth of Resevoir Float > 0 Millimetres The depth of the storage reservoir, this is usually the total depth of the system that can contain the root zone. Depending upon the plant species they may not fully utilize the entire depth. Average Voidspace Ratio Float ≥ 0 and ≤ 100 Percent The void space ratio is a measure of the spaces within the structure of the soil that can contain either air and/or water. A normally compacted planting medium can have 50% void space that can contain air and/or water. A fine soil will naturally have a greater amount of void space but the spaces may not be as visible when compared to a gravel soil. A uniformly graded soil, that is one with soil particles of nearly the same size will have a greater void space than a well graded soil where there is a wide range of particle sizes. Facility Open to Rainfall? Boolean Yes or No n/a Required if Type is Infiltration Trench Ponding Depth Float > 0 Millimetres Optional if Type is Infiltration Swale - Without Underdrain, Rain Garden - Without Underdrain, Box Planter - Without Underdrain or Infiltration Trench If water can pond on the surface of the system the depth can be included in the calculations for the storage capability of the system. -
-
- Design Source Controls - With Storage [Link]
-
These systems affect the surface runoff and come into play after the Surface Enhancements are filled and are producing surface runoff. These runoff control or Low Impact Development (LID) facilities provide discharge control or reduce surface runoff volumes following the calculations of catchment hydrology. These systems typically include a storage volume and can include infiltration to ground. The infiltration will be in addition to the surface infiltration calculated for the catchment. LIDs falling into this include:
-
infiltration galleries
-
rain gardens
-
retention ponds
-
some forms of green roofs
-
most bio-filtration swales
The key to this type of LID analysis include a reduction of surface runoff after it occurs and some volume of stored water.
Inputs for Specify Where Source Controls - With Storage Will Be Located
Field Affects Type Value Units Required? Description Use Above Ground Source Controls Boolean Yes or No, it must be the opposite of Use Below Ground Source Controls n/a Required Use Below Ground Source Controls Yes or No, it must be the opposite of Use Above Ground Source Controls Inputs for Design Source Controls - With Storage
Field Affects Type Value Units Required? Description Type String If Use Above Ground Source Controls is Yes, Infiltration Swale - With Underdrain, Green Roof - With Underdrain, Rain Garden - With Underdrain, Inflitration Pond or Box Planter - With Underdrain, otherwise;
if Use Below Ground Source Controls is Yes, Underground Source Controln/a Required This identifies the type of source control - surface enhancement. Soil Definition String n/a Required except if Type is Underground Source Control The soil definition selected for a source control - with storage refers to a set of specific soil properties. Source Control - With Storage: Wilting Point Soil Moisture Float ≥ 0 and ≤ 100 Percent Required if Permeability is Pervious Source Control - With Storage: Field Capacity Float ≥ 0 and ≤ 100 Percent Design Soil Rooting Depth Float > 0 Millimetres The rooting depth is generally the total depth of soil that would be available for moisture storage and root growth. Each plant has a growth pattern that may not take advantage of the entire depth that is available. Crop Coefficient Float ≥ 0 and ≤ 1 Ratio The crop coefficient is simply a ratio of plant water demand to natural evaporation. Use 1.0 unless you have a more accurate estimate of the plants water consumption. Infiltration Rate (Per Hour) Float > 0 Millimetres⁄Hour Required The infiltration rate into the ground. Infiltration Rate (Per Second) Metres⁄Second Depth of Resevoir Float > 0 Millimetres Required except if Type is Infiltration Pond The depth of the storage reservoir, this is usually the total depth of the system that can contain the root zone. Depending upon the plant species they may not fully utilize the entire depth. Average Voidspace Ratio Float ≥ 0 and ≤ 100 Percent The void space ratio is a measure of the spaces within the structure of the soil that can contain either air and/or water. A normally compacted planting medium can have 50% void space that can contain air and/or water. A fine soil will naturally have a greater amount of void space but the spaces may not be as visible when compared to a gravel soil. A uniformly graded soil, that is one with soil particles of nearly the same size will have a greater void space than a well graded soil where there is a wide range of particle sizes. Ponding Depth Float > 0 Millimetres Optional except if Type is Underground Source Control If water can pond on the surface of the system the depth can be inculed in the calculations for the storage capability of the system. -
-
- Apply Source Controls [Link]
-
Source Controls may be applied to the surface conditions defined on the modelled area’s drainage area. Three different types of source control nodes may be placed on a surface condition node (and they may be combined): source controls - surface enhancements, source controls - with storage and connected treatment areas.
Inputs for Applied Source Controls - Surface Enhancements
Field Affects Type Value Units Required? Description Surface Area of Source Control - Surface Enhancements
(As an Area)Surface Area of Source Control - Surface Enhancements (As a Percent) Float > 0 and ≤ the parent Surface Condition: Size (As an Area) node Hectares, Acres or Sq. Metres; Required Surface Area of Source Control - Surface Enhancements
(As a Percent)Surface Area of Source Control - Surface Enhancements (As an Area) > 0, and all source controls in a surface condition must add up to 100% or less Percent Inputs for Applied Source Controls - With Storage
Field Affects Type Value Units Required? Description Surface Area of Source Control - With Storage
(As an Area)Surface Area of Source Control - With Storage (As a Percent) Float > 0 and ≤ the parent Surface Condition: Size (As an Area) node Hectares, Acres or Sq. Metres; Required Surface Area of Source Control - With Storage
(As a Percent)Surface Area of Source Control Size - With Storage (As an Area) > 0, and all source controls in a surface condition must add up to 100% or less Percent Baseflow Pipe Diameter Float > 0 Millimetres Absolute Discharge Rate (As a Volume) Float > 0 Cu. Metres;⁄Second Area-Based Discharge Rate (Per Hectare) Litres⁄Second⁄Hectare Inputs for Applied Connected Treatment Areas
Field Affects Type Value Units Required? Description Area Treated By: Source Contro
- With Storagen/a n/a Required Each treatment area has a source control - with storage that is performing the actual treatment. Connected Treatment Areas: Size
(As an Area)Connected Treatment Areas: Size (As a Percent) Float > 0 and ≤ the parent Surface Condition: Size (As an Area) node Hectares, Acres or Sq. Metres; Connected Treatment Areas: Size
(As a Percent)Connected Treatment Areas: Size (As an Area) > 0, and all source controls in a surface condition must add up to 100% or less Percent
-
- Configure Off-Site Storage [Link]
-
Off site storage is in the form of detention ponds that function to limit discharges to downstream drainage systems or streams. These systems are typically placed at a neighbourhood, or regional level. They are not applied at a site level.
Inputs for Discharge Rates
Field Affects Type Value Units Required? Description Watershed Discharge Rate (As a Volume) Float > 0 Cu. Metres;⁄Second Required if Using Entered Discharge Rate Watershed Discharge Rate (Per Hectare) Litres⁄Second⁄Hectare Overflow Pipe Diameter Float > 0 Millimetres Required if Using Calculated Discharge Rate Discharge Pipe Diameter Weir Length Metres Inputs for Off-Site Storage Volume
Field Affects Type Value Units Required? Description Area of Pond Surface Float > 0 and > Area of Pond Floor Metres² Required Area of Pond Floor > 0 and < Area of Pond Surface Pond Depth > 0 Metres Evaporation Coefficient > 0 Coefficient
-
- Configure Stream [Link]
-
Defining a typical, or a critical, stream section allows a determination of the energy available to cause stream erosion.
Inputs for Stream Parameters
Field Affects Type Value Units Required? Description Left Stream Bank Float > 0 Metres⁄Metres Required Right Stream Bank Bed Width Metres Stream Depth Measured stream depth at midpoint of reach. Slope of Reach
(As a Slope)Metres⁄Metres Slope of Reach
(As the Run)Horizontal Metres per Vertical Metre Type String Excavated channel in hard packed sand, Excavated channel in silty clay loam with hard bed, Exposed gravel bed without silt between rocks, Excavated channel with grass on side slopes, Straight cobble lined channel, Irregular channel with cobble bottom and sides, Irregular channel with cobble bottom and grassed sides, Irregular channel with cobble bottom and brush sides, Irregular channel with cobble bottom, brush encroaching on bottom, Irregular channel with grassed bottom, brush on sides, Irregular channel with brush on bottom and sides n/a Stream Bed Roughness Float > 0 n Safe Non-Eroding
Stream VelocityFloat > 0 Metres⁄Second
-
- Soil Properties [Link]
-
Values that describe the specific properties of soils may be entered in four different places in the Water Balance Model. Three of these (surface conditions, source controls - surface enhancements and source controls - with storage) have identical input fields, and the fourth (native soil types) allows only a subset of the fields. Refer to the native soil types inputs tables for the complete details of that particular soil entry table. All other soils allow the following inputs.
Inputs for Soil Properties
Field Affects Type Value Units Required? Recommended Values Description Permeability String Pervious or Impervious n/a Required n/a Depression Storage Float > 0 Millimetres Required n/a Retardance Roughness Time of Concentration Float ≥ 0 Ratio Required 0.02 for smooth pavement
0.03 for poor grass, bare sod
0.08 for natural range
0.15 for short prairie grass
0.30 for dense lawn / sod
0.40 for woods
Defaults to 0.03Alter the quickness that surface runoff flows across the drainage area; calculation of the travel time of runoff for the base case scenario uses this value. Rational Coefficient Time of Concentration Float ≥ 0 Ratio Required 0.05-0.20 for sandy soil lawn
0.15-0.35 for heavy soil lawn
0.50-0.75 for single family residential
0.70-0.95 for downtown business
Defaults to 0.5Alter the quickness that surface runoff flows across the drainage area; calculation of the travel time of runoff for the base case scenario uses this value. Soil Type:
SandWilting Point, Field Capacity, Maximum Water Content Integer ≥ 0 and ≤ 100, and the total sand and clay must be ≤ 100 Percent Required if Permeability is Pervious Heavy Clay, Silty Clay, Clay, Sandy Clay, Silty Clay Loam, Clay Loam, Sandy Clay Loam, Silty Loam, Loam, Silt, Sandy Loam, Loamy Sand and Sand Review the soil texture triangle to find the specific sand/clay breakdown that is present in each of the soil types. Soil Type:
ClayOrganics
% by WeightFloat ≥ 0.0 and ≤ 8.0 Percent n/a Gravel
% by WeightFloat ≥ 0.0 and ≤ 50.0 Percent n/a Compaction Float ≥ 0.9 and ≤ 1.9 Co-efficient 0.9 Loose
1.0 Normal
1.1 Dense
1.2 Hard
1.3 SevereThe Soil Texture Triangle
-
-
Mapping Data to QUALHYMO [Link]
-
- Preamble [Link]
-
The preceding sections of this document have covered the data that is input into the Water Balance Model and any interim calculations that are triggered by, or required to facilitate, this process. Once a complete set of data has been input into the model, it can be translated into the input file that QUALHYMO requires. Combined with the climate data files, QUALHYMO is now able to run the computations needed to generate the outputs of the Water Balance Model. This chapter is split into two parts; the first covers the organization of QUALHYMO's commands, and the second maps how each command relates to the data input.
-
- Command Configuration [Link]
-
Interacting with the QUALHYMO executable consists of structuring a series of commands with calculated and assigned parameters. The Water Balance Model will select a set of commands to use based on one of several pre-arranged configurations; the configuration used depends on the project type, source controls used, presence of off-site storage and a stream. With the exception of the START and FINISH commands, each QUALHYMO command uses ID numbers to track the movement of data from one step to the next; these numbers are shown in a small circle next to each connection. There are four diagrams, one for each project type. Not all of the commands in each diagram are required, some are optional based on the inclusion of source controls - with storage, or a variety of options chosen on a scenario by scenario basis. The following series of processing diagrams illustrate each configuration.
Site Configuration
This could be situated anywhere in the watershed; it is a basic building block and represents what has been brought forward from the original Water Balance Model.
Development Configuration
Development with Stream Configuration
Note the optional off-site storage portion on the diagram; this is selectable on a scenario by scenario basis.
Watershed Configuration
Building on the previous configurations, the watershed adds a second generate command to the system.
-
- Parameter Summary [Link]
-
Sub-sections:
This section covers all of the various parameters that make up QUALHYMO's commands used within the Water Balance Model. Note where values entered in the data inputs of the user interface have been carried through and transformed into the values now used to run the simulation. Parameters have been grouped by their parent commands, which are in turn presented chronologically as per the command configuration diagrams.
-
- Configuration Commands [Link]
-
Sub-sections:
These are the first commands executed by QUALHYMO; no matter what command configuration is dictated by the project type and various options, they are always present.
-
- START Command [Link]
-
Within the Water Balance Model, the START command designates the outer bounds of the climate data series that will be used for the simulation and may have evaporation related parameters modified by the presence of source controls - with storage and/or off-site storage.
START Command Parameters
Parameter Value Description IGYA = StartyearCode Starting year of the simulation. See QUALHYMO User Manual for details. IGMA = Startmonth Starting month of the simulation. See QUALHYMO User Manual for details. IGDA = Startday Starting day of the simulation. See QUALHYMO User Manual for details. IGYB = EndyearCode Final year of the simulation. See QUALHYMO User Manual for details. IGMB = Endmonth Final month of the simulation. See QUALHYMO User Manual for details. IGDB = Endday Final day of the simulation. See QUALHYMO User Manual for details. IRAIN = 9 Identifies rainfall file. See QUALHYMO User Manual for details. IPFORM = 1 Specifies format of rainfall file. See QUALHYMO User Manual for details. IFLOW = 10 Specifies input value for flow file. See QUALHYMO User Manual for details. ITFORM = 1 There are actually 3 values (0, 1, 2) that can be used depending on the format of the climate data. A value of 1 corresponds to the AES format. See QUALHYMO User Manual for details. ICASE = 2 As with the ITFORM, all evaporation data is from file, so the values is always 2. See QUALHYMO User Manual for details. CPAN = 1 For this version of the Water Balance Model, CPAN will be set as a constant 1. EVAPCASE = 2 if source controls - with storage or off-site storage are included in the scenario, otherwise;
= 0Specifies pond evaporation options. See QUALHYMO User Manual for details. PPAN = 1 if EVAPCASE = 2, otherwise;
= blankPan evaporation correction coefficient for POND command. See QUALHYMO User Manual for details. IFDECA = 0 Controls pollutant simulation. See QUALHYMO User Manual for details. IFSEDT = 0 Controls sediment simulation. See QUALHYMO User Manual for details.
-
-
- Drainage Area Commands [Link]
-
Sub-sections:
-
- GENERATE Command [Link]
-
QUALHYMO's GENERATE command is responsible for processing each drainage area in the scenario. Project area, each drainage area's configuration and any soils that are a part of a source control - surface enhancement or source control - with storage, all contribute to the parameters listed below. Some of the values required are pre-selected; in those cases, refer to the description column for details.
GENERATE Command Parameters
Parameter Value Description ID = X, Y or Z Refer to the Command Configuration diagrams and text for the specifics of how the ID and ISER numbers are selected. ISER = X, Y or Z DT = 1 Specifies computation time step. See QUALHYMO User Manual for details. DA = DrainageAreada AB = 0 Controls printing of unit hydrographs. See QUALHYMO User Manual for details. FRIMP = DrainageAreafrimp Fraction of directly connected impervious area. See QUALHYMO User Manual for details. AAImpervious = 1 Specifies unit hydrographic type. See QUALHYMO User Manual for details. XKImpervious = 2 Hydrographic shape parameter. See QUALHYMO User Manual for details. TPImpervious = 1 Hydrographic shape parameter. See QUALHYMO User Manual for details. ABSIMP = DrainageAreaabsimp Impervious initial abstraction. See QUALHYMO User Manual for details. RIMP = 0.9 Impervious runoff coefficient. See QUALHYMO User Manual for details. CETIMP = CPAN Impervious area evaporation correction coefficient. See QUALHYMO User Manual for details. AAPervious = 1 Specifies unit hydrographic type. See QUALHYMO User Manual for details. XKPervious = 2 Hydrographic shape parameter. See QUALHYMO User Manual for details. TPPervious = 1 Hydrographic shape parameter. See QUALHYMO User Manual for details. SMIN = DrainageAreasmin Minimum S. See QUALHYMO User Manual for details. SMAX = DrainageAreasmax Maximum S. See QUALHYMO User Manual for details. SK = 0.1 S change. See QUALHYMO User Manual for details. APIK = 0.9 Parameter. See QUALHYMO User Manual for details. API = ( SMIN + SMAX ) ÷ 2 Initial API value. See QUALHYMO User Manual for details. ABSPER = DrainageAreaabsper Pervious initial abstraction. See QUALHYMO User Manual for details. CETPER = 1 Pervious area evaporation correction coefficient. See QUALHYMO User Manual for details. NVSOL = 0 Number of soil resevoir for baseflow simulation. See QUALHYMO User Manual for details. BASMIN = 0 Minimum baseflow rate. See QUALHYMO User Manual for details. BFACR = 1 Baseflow coefficient. See QUALHYMO User Manual for details. SVOL = SMAX Starting resevoir volume. See QUALHYMO User Manual for details. SWILT = SMIN Minimum SVOL for baseflow. See QUALHYMO User Manual for details. SFIELD = 150 Soil field capacity. See QUALHYMO User Manual for details. SLOSKA = 0.00001 Recession constant. See QUALHYMO User Manual for details. SLOSKB = 0.00001 Reduction factor. See QUALHYMO User Manual for details. CET = -1 ET coefficient. See QUALHYMO User Manual for details. ISNOW = 1 Sets snowmelt method. See QUALHYMO User Manual for details. BASET = 0 Melt temperature. See QUALHYMO User Manual for details. SNOWFAC = 0.125 Calibration coefficient. See QUALHYMO User Manual for details. PACDEP = 0 Starting pack depth. See QUALHYMO User Manual for details. ALPHAA = 2.5 Calibration coefficient. See QUALHYMO User Manual for details. XLK = 15 Thermal conductivity ratio. See QUALHYMO User Manual for details. BCOEF = 1.1 Proportionality constant. See QUALHYMO User Manual for details. XNCOEF = 150 Insulation factor. See QUALHYMO User Manual for details. KFLAG = 0 Sets removal option. See QUALHYMO User Manual for details.
-
-
- Source Controls - With Storage Commands [Link]
-
Sub-sections:
If any source controls - with storage are included in the scenario this set of commands is run to simulate the affect of the accumulated reservoirs.
-
- First SPLIT SERIES Command [Link]
-
The first of two SPLIT SERIES commands, this one controls how much of the moisture provided by the climate data is captured and treated by the source controls' reservoirs.
First SPLIT SERIES Command Parameters
Parameter Value Description IDIN = X, Y or Z Refer to the Command Configuration diagrams and text for the specifics of how IDIN, IDOUTA, ISERA, IDOUTB and ISERB numbers are selected for each command in the scenario. See QUALHYMO User Manual for details. IDOUTA = X, Y or Z ISERA = X, Y or Z IDOUTB = X, Y or Z ISERB = X, Y or Z NPTQQ = 2 See QUALHYMO User Manual for details. qinA = 0 See QUALHYMO User Manual for details. qoutA = 0 See QUALHYMO User Manual for details. qinB = SourceControlSplitqinb See QUALHYMO User Manual for details. qoutB = SourceControlSplitqoutb See QUALHYMO User Manual for details.
-
- POND Command [Link]
-
POND Command Parameters
-
- Second SPLIT SERIES Command [Link]
-
Second SPLIT SERIES Command Parameters
Parameter Value Description IDIN = X, Y or Z Refer to the Command Configuration diagrams and text for the specifics of how a IDIN, IDOUTA, ISERA, IDOUTB and ISERB numbers are selected for each command in the scenario. See QUALHYMO User Manual for details. IDOUTA = X, Y or Z ISERA = X, Y or Z IDOUTB = X, Y or Z ISERB = X, Y or Z NPTQQ = 3 See QUALHYMO User Manual for details. qinA = 0 See QUALHYMO User Manual for details. qoutA = 0 See QUALHYMO User Manual for details. qinB = SourceControlLossesqinb See QUALHYMO User Manual for details. qoutB = SourceControlLossesqoutb See QUALHYMO User Manual for details. qinC = SourceControlLossesqinc See QUALHYMO User Manual for details. qoutC = SourceControlLossesqoutc See QUALHYMO User Manual for details.
-
- ADD SERIES Command [Link]
-
This command allows users to add two series together.
ADD SERIES Command Parameters
Parameter Value Description IDOUT = X, Y or Z Refer to the Command Configuration diagrams and text for the specifics of how a IDOUT, ISERA, IDINA and IDINB numbers are selected for each command in the scenario. See QUALHYMO User Manual for details. ISERA = X, Y or Z IDINA = X, Y or Z IDINB = X, Y or Z
-
-
- Watershed Commands [Link]
-
Sub-sections:
-
- ADD SERIES Command [Link]
-
QUALHYMO’s ADD SERIES Command must follow at least two commands creating output series, or must be used in a situation where two output series exist as the command requires two input series to function. Several ADD SERIES can be used in sequence.
ADD SERIES Command Parameters
Parameter Value Description IDOUT = X, Y or Z Refer to the Command Configuration diagrams and text for the specifics of how a IDOUT, ISERA, IDINA and IDINB numbers are selected for each command in the scenario. See QUALHYMO User Manual for details. ISERA = X, Y or Z IDINA = X, Y or Z IDINB = X, Y or Z
-
-
- Off-Site Storage Commands [Link]
-
Sub-sections:
-
- POND Command [Link]
-
This command includes a substantial range of capabilities. It can represent:
-
A bypass around the whole facility, which sends a stream of inflow around the pond untreated and unrouted, to rejoin the effluent from the pond at its outlet
-
Evaporation from the pond, which is a loss from the system
-
A passive gate that always functions to provide an outlet as water in the pond raises and lowers
-
An operated gate that is closed at the beginning of an inflow into the pond is a specified base flow amount and that opens after inflow ceases and a specified detention time (TDET) passes.
POND Command Parameters
-
-
- CALC POND STATS Command [Link]
-
This command allows users to develop statistics of the long time series generated in the POND command. This command must follow a POND Command, and will develop data for only the most recent preceding POND command. Several CALC POND STATS can be used in sequence. The result is a set of four listings of monthly maximum and minimum data and annual maximum and minimum data.
-
-
- Output Commands [Link]
-
Sub-sections:
-
- MAXMIN Command [Link]
-
This command allows users to develop maximum and minimum monthly and annual flow rate and volume statistics from an internally generated QUALHYMO time series.
MAXMIN Command Parameters
Parameter Value Description ID = X, Y or Z Refer to the Command Configuration diagrams and text for the specifics of how an ID number is selected. See QUALHYMO User Manual for details. monthOrYear = 1 Identifies what needs to be created. See QUALHYMO User Manual for details. startYear = Startyear Starting year of the simulation. See QUALHYMO User Manual for details. endYear = Endyear Final year of the simulation. See QUALHYMO User Manual for details.
-
- EXCEEDANCE Command [Link]
-
This command allows users to develop exceedance curves for any time series generated by the model.
EXCEEDANCE Command Parameters
-
-
-
-
Graphic Outputs [Link]
-
- Preamble [Link]
-
After QUALHYMO completes the hydrologic and routing calculations and provides the summary of discharges for flow magnitude, volumes and exceedance, the results are extracted and sorted for comparison between various scenarios for a project. Currently, The Water Balance Model also does the calculation of the stream power and potential erosion. This will be built into QUALHYMO in the future.
After the calculation and extraction processes are completed, the Water Balance Model system takes all of the numerical results and provides graphical and tabular results summaries for the project and scenario comparisons. These graphic outputs are available through interface displays of charts and through tables available in export and print for reporting.
-
- Exceedance Summary [Link]
-
The first of three comparison graphs generated by QUALHYMO based on the entered parameters and selected climate data. The exceedance summary displays the amount of runoff (as Duration vs. Rate) from the modeled drainage area over the length of the available climate data. Each scenario within the project is displayed simultaneously to allow for easy visual comparisons. In addition, as each data point has the mouse moved over it, the exact data is revealed.
-
- Volume Summary [Link]
-
The second comparison graph; each scenario is displayed again, but this time accounting where the water within the model has ended up. Typically, volumes for Total Discharge (run off), Total Losses (evaporation) and Catchment Infiltration are found in every scenario, and a volume for Source Control Infiltration is only found when source controls with storage are present.
-
- Printable Report [Link]
-
In addition to the graphic feedback included above, the Water Balance Model generates an HTML report that can be printed directly from the browser, or saved for later reference. The report has a record of every value entered into the particular scenario, and a numerical summary of the results generated by QUALHYMO.
-
-
Equation and Data Reference [Link]
-
- Preamble [Link]
-
The Water Balance Model contains many equations; some are ‘convenience’ equations that have no hard bearing on the outputs of the model, but aide a user in completeing the data inputs, and others are used to derive values that will have a measurable effect. In addition to simply browsing this chapter, there are several ways to find the equation that you may be looking for:
-
What Triggered the Calculation?
In the case of convenience functions based on user input, there are links from the inputs tables in the data inputs chapter to each formula that is calculated. Some calculations may trigger further calculations.
-
Where Does that Value Come From?
For QUALHYMO commands, any parameter that is not prespecified by the Water Balance Model is adjustable via user input. In the parameter summary section in the mapping data to QUALHYMO chapter, each table of command parameters has a number of links to the equations and formulae that will calculate the required values.
Finally, any section in this chapter that yields values for a QUALHYMO command has a table summarizing the parameters and the command that they are a part of.
-
-
- Examples [Link]
-
Care has been taken to format each equation and formula so that they are both easy to read, and link back to the orginal source. All equations are displayed on a light grey background, with variable names in red, and values that have come directly from a data input as a hyperlink back to the specific input.
Sample Formula
A = 50
SumValue = ( 10 + A ) * Drainage Area: Size (As an Area)
Readers familiar with computer programming will recognize the basic format of the sample formula. The SumValue variable on the left-hand side of the equals sign is assigned the results of the calculations on the right-hand side. Given a drainage area size of 2000, the value assigned to SumValue will be 120000.
It is common to run some equations many times over — for each and every surface condition (or native soil type, or drainage area, etc.) — and then sum the results. These will appear in a format similar to this:
Sample Formula for Calculating Sums
Valuex = Surface Condition: Retardance Roughness
Valuesum = Value1 + Value2 + Value3 + …
The first line of the formula indicates that the variable is Valuex; this indicates that it is a container, and each time the equation is computed, a new ‘pocket’ in created. In the second line, each pocket is then added together.
Not all formula deal exclusively with mathematics; certain parameters are entered as a series of character: strings. Dates are a good example of this:
Sample Formula for String Manipulation
Year = Start Date [--/--/--YY]
In the example above, only the last two digits of the four digit year portion of the start date data input is stored in the Year variable. The date, month and first two digits of the year are simply discarded.
-
- Data Input Equations [Link]
-
Sub-sections:
-
- Drainage Area [Link]
-
Sub-sections:
A number of formulae pre-calculate values in each drainage area.
-
- Retardance Roughness [Link]
-
Every surface condition in base case scenario contributes to the project's retardance roughness. The following calculation is performed once for every surface condition (the drainage area, native soil type and land use values are from the nodes that are direct parents of the current surface condition):
RetRoughx = Surface Condition: Retardance Roughness * ( ( Drainage Area: Size (As a Percent) ÷ 100 ) * ( Native Soil Type: Size (As a Percent) ÷ 100 ) * ( Land Use: Size (As a Percent) ÷ 100 ) * ( Surface Condition: Size (As a Percent) ÷ 100 ) )
After every surface condition node has been processed, the results of each are added together and that is the new retardance roughness value.
Retardance Roughness = RetRough1 + RetRough2 + RetRough3 + …
-
- Rational Coefficient [Link]
-
Every sufrace condition in base case scenario contributes to the project's rational coefficient. The following calculation is performed once for every surface condition (the drainage area, native soil type and land use values are from the nodes that are direct parents of the current surface condition):
RatCox = Surface Condition: Rational Coefficient * ( ( Drainage Area: Size (As a Percent) ÷ 100 ) * ( Native Soil Type: Size (As a Percent) ÷ 100 ) * ( Land Use: Size (As a Percent) ÷ 100 ) * ( Surface Condition: Size (As a Percent) ÷ 100 ) )
After every surface condition node has been processed, the results of each are added together and that is the new rational coefficient value.
Rational Coefficient = RatCo1 + RatCo2 + RatCo3 + …
-
- Size (As an Area) [Link]
-
In the case of watershed project types, a user may enter the size of each drainage area as a Percent of the entire project area.
Drainage Area: Size (As an Area) = ( Drainage Area: Size (As a Percent) ÷ 100 ) * Model Area
-
- Size (As a Percent) [Link]
-
In the case of watershed project types, a user may enter the size of each drainage area as an area (hectares, acres or Sq. Metres;) of the same unit type as the project.
Drainage Area: Size (As a Percent) = ( Drainage Area: Size (As an Area) ÷ Model Area ) * 100
-
- Slope [Link]
-
Users have the option of entering a slope value, or may have one calculated for them:
Slope = ( High Elevation - Low Elevation ) ÷ Length of Drainage Area
-
-
- Native Soil Types [Link]
-
Sub-sections:
A number of formula pre-calculate values in each drainage area.
-
- Size (As an Area) [Link]
-
A user may enter the size of each native soil type node as a Percent of their parent drainage area.
Native Soil Types: Size (As an Area) = ( Native Soil Types: Size (As a Percent) ÷ 100 ) * Drainage Area: Size (As an Area)
-
- Size (As a Percent) [Link]
-
A user may enter the size of each native soil type node as an area (hectares, acres or Sq. Metres;) of the same unit type as the project.
Native Soil Types: Size (As a Percent) = ( Native Soil Types: Size (As an Area) ÷ Drainage Area: Size (As an Area) ) * 100
-
-
- Land Uses [Link]
-
A user has two options for selecting and applying land uses. They may either select a land use from a predefined list of uses, or assemble a custom use, which can be just one or a blend of two or more of the predefined options. In the case of multiple options being combined together, the user must indicate what the Percent mix is of the constituent parts, to a total of 100%. When applying the land use, the coverage it applies to its parent soil type can be entered either as a Percent of the parent area or as an absolute value. Entering either value will automatically derive the other, based on the total size of the parent soil area the surface condition has been applied to, using the following equation:
Land Uses: Size (As a Percent) = (Land Uses: Size (As an Area) / Native Soil Types: Size (As an Area)) * 100
Land Uses: Size (As an Area) = Native Soil Types: Size (As an Area) * (Land Uses: Size (As a Percent) / 100)
-
- Surface Conditions [Link]
-
Surface Conditions are treated as soil types by the WBM, with additional properties added to them. These include permeability, retardance roughness, depression storage and rational coefficient, which are typed in directly by the user during creation. A list of preset surface conditions is also available. They are applied in the same manner as Land Uses (percent coverage or absolute value). Surface conditions listed as permeable must also have a depth parameter set during application, which is used to calculate permeable water storage capacity by QUALHYMO.
Surface Conditions: Size (As a Percent) = (Surface Conditions: Size (As an Area) / Land Uses: Size (As an Area)) * 100
Surface Conditions: Size (As an Area) = Land Uses: Size (As an Area) * (Surface Conditions: Size (As a Percent) / 100)
-
- Design Source Controls - Surface Enhancements [Link]
-
Source Controls are also treated as specialized soil layers by the WBM. Starting with any predefined or custom soil, the source control will have the user set several possible additional values (based on type). These include: Design Soil Rooting Depth, Crop Coefficient, Depth of Reservoir, Voidspace Ratio, whether or not the facility is Open to Rainfall, Ponding Depth, and Infiltration Rate, which can be set in one of two ways. Setting this value in one way will automatically calculate the other value, in one of the following ways:
Surface Enhancements: Infiltration Rate in mm/h = Surface Enhancements: Infiltration Rate in m/s * 3600000
Surface Enhancements: Infiltration Rate in m/s = Surface Enhancements: Infiltration Rate in mm/h / 3600000
-
- Apply Source Controls [Link]
-
Source Controls are applied in a similar manner to Land Uses and Surface Conditions, taking up an area defined either as a Percent of the parent Surface Condition, or as an absolute size. Additionally, some Source Controls must have their Discharge Rate determined, which can be done in one of three ways:
As calculated by the size of the Baseflow Pipe Diameter:
Contraction Coefficient = 0.6
Gravity = 9.81
Pipe Radius = (Baseflow Pipe Diameter / 1000) / 2
Area = PI * Pipe Radius2
Head Depth = (((Design Soil Rooting Depth * Average Voidspace Ratio) + Ponding Depth) / 1000) - Pipe Radius
Absolute Discharge Rate = Contraction Coefficient * Area * (2 * Gravity * Head Depth)2
Area-Based Discharge Rate = 1000 * Absolute Discharge Rate / Catchment Size
-
- Configure Off-Site Storage [Link]
-
Off-Site Storage (only available in some scenario types) is determined by a set of user entered values, one of which (Discharge Rate, optional) can be determined in one of two ways
Watershed Discharge Rate in m3/s = Watershed Area: Size (As an Area)* (Watershed Discharge Rate in L/s/ha / 1000)
Watershed Discharge Rate in L/s/ha = (1 / Watershed Area: Size (As an Area)) * (Watershed Discharge Rate in m3/s * 1000)
-
- Configure Stream [Link]
-
The Stream (only available in some scenario types) is configured by a set of user entered values, one of which (Slope of Reach) can be determined in one of two ways:
Slope of Reach in m/m = (1 / Slope of Reach in Horizontal Metres per Vertical Metre)
-
- Soil Calculations [Link]
-
Sub-sections:
The following formula and equations for soils are used in several different ares in the Water Balance Model. All are from Saxton et al. 2006.
-
- Wilting Point [Link]
-
The calculated wilting point of a soil will be used in preparing some of the input parameters for QUALHYMO. They are from Saxton et al. 2006
Sand = Soil Type: Sand ÷ 100
Clay = Soil Type: Clay ÷ 100
Gravel = Gravel % by Weight ÷ 100
WP1 = ( -0.024 * Sand ) + ( 0.487 * Clay ) + ( 0.006 * Organics % by Weight ) + ( 0.005 * Sand * Organics % by Weight ) - ( 0.013 * Clay * Organics % by Weight ) + ( 0.068 * Sand * Clay ) + 0.031
WP2 = WP1 + ( 0.14 * WP1 ) - 0.02
WiltingPoint = WP2 * 100
-
- Field Capacity [Link]
-
The calculated field capacity of a soil will be used in preparing some of the input parameters for QUALHYMO.
Sand = Soil Type: Sand ÷ 100
Clay = Soil Type: Clay ÷ 100
FC1 = ( -0.251 * Sand ) + ( 0.195 * Clay ) + ( 0.011 * Organics % by Weight ) + ( 0.006 * Sand * Organics % by Weight ) - ( 0.027 * Clay * Organics % by Weight ) + ( 0.452 * Sand * Clay ) + 0.299
FC2 = FC1 + ( ( 1.283 * FC12 ) - ( 0.374 * FC1 ) - 0.015 )
FC3 = ( 0.278 * Sand ) + ( 0.034 * Clay ) + ( 0.022 * Organics % by Weight ) - ( 0.018 * Sand * Organics % by Weight ) - ( 0.027 * Clay * Organics % by Weight ) - ( 0.584 * Sand * Clay ) + 0.078
FC4 = FC3 + ( ( 0.636 * FC3 ) - 0.107 )
FC5 = FC4 + FC2
FC6 = ( -0.097 * Sand ) + 0.043
FC7 = FC5 + FC6
FC8 = ( 1 - FC7 ) * 2.65
FC9 = FC8 * Compaction
FC10 = ( 1 - ( FC9 ÷ 2.65 ) ) - ( 1 - ( FC8 ÷ 2.65 ) )
FC11 = FC2 + ( 0.25 * FC10 )
FieldCapacity = FC11 * 100
-
- Maximum Water Content [Link]
-
The calculated wilting point of a soil will be used in preparing some of the input parameters for QUALHYMO. They are from Saxton et al. 2006
Sand = Soil Type: Sand ÷ 100
Clay = Soil Type: Clay ÷ 100
MWC1 = ( -0.251 * Sand ) + ( 0.195 * Clay ) + ( 0.011 * Organics % by Weight ) + ( 0.006 * Sand * Organics % by Weight ) - ( 0.027 * Clay * Organics % by Weight ) + ( 0.452 * Sand * Clay ) + 0.299
MWC2 = MWC1 + ( ( 1.283 * MWC12 ) - ( 0.374 * MWC1 ) - 0.015 )
MWC3 = ( 0.278 * Sand ) + ( 0.034 * Clay ) + ( 0.022 * Organics % by Weight ) - ( 0.018 * Sand * Organics % by Weight ) - ( 0.027 * Clay * Organics % by Weight ) - ( 0.584 * Sand * Clay ) + 0.078
MWC4 = MWC3 + ( ( 0.636 * MWC3 ) - 0.107 )
MWC5 = MWC4 + MWC2
MWC6 = ( -0.097 * Sand ) + 0.043
MWC7 = MWC5 + MWC6
MWC8 = ( 1 - MWC7 ) * 2.65
MWC9 = MWC8 * Compaction
MWC10 = 1 - ( MWC9 ÷ 2.65 )
MaximumWaterContent = MWC10 * 100
-
-
- Time of Concentration [Link]
-
The Water Balance Model calculates time of concentration independantly of QUALHYMO. Four separate equations are used to calculate time of concentration values, with a fifth to derive a final value. The four used initially are:
-
Kerby’s
-
Kirpich
-
Bransby
-
FAA
Each equation uses several of the following values:
Retardance Roughness
Rational Coefficient
Watershed Area
The size of a drainage area may be entered in any of three units: hectares, acres or Sq. Metres;; for the next set of equations, the value must be converted to miles².
-
For hectares:
A = Drainage Area: Size (As an Area) ÷ 258.999
-
For acres:
A = Drainage Area: Size (As an Area) ÷ 640
-
For metres²:
A = Drainage Area: Size (As an Area) ÷ 2589988.11
Slope
S = Slope
Length of Overland Flow
L = Length of Drainage Area ÷ 0.3048
The Four Time of Concentration Equations
Kirby’s Equation
KirbyToC = 0.83 * ( L * R * S-0.5 )0.467
Kirpich Equation
KirpichToC = 0.0078 * ( L0.77 ÷ S0.385 )
Bransby Equation
BransbyToC = ( 21.3 * L ÷ 5280 ) * ( 1 ÷ ( A0.1 * S0.2 ) )
FAA Equation
FAAToC = ( 1.8 * ( 1.1 - C ) * L0.5 ) ÷ ( S * 100 )0.33
Deriving the Final Time of Concentration Value
Drop the highest and lowest results from the previous four calculations. The following equation can be solved with the two remaining (ToC1 and ToC2) values:
ToCInMinutes = ( ToC1 + ToC2 ) ÷ 2
If ToCInMinutes is < 10, it will be assigned a value of 10. Finally, the Water Balance Model uses the time of concentration in hours:
ToCInHours = ( ToCInMinutes ) ÷ 60
-
-
- Scaling Factor [Link]
-
With the time of concentration calculated, a scaling factor for the project may be calculated. If the calculated time of concentration is greater than or equal to 1, simply assign the scaling factor
ScalingFactor = 1
Otherwise, if the time of concentration is less than 1, the scaling factor must be calculated.
ScalingFactor = 60 ÷ ( ToCInHours * 60 )
-
-
- QUALHYMO Parameter Equations [Link]
-
Sub-sections:
The Water Balance Model employs defined equations as a method of calculating the parameters required for QUALHYMO inputs from users inputs.
-
- Date Formatting [Link]
-
Sub-sections:
These dates represent the outer bounds of the climate series that will be used during the simulation. They may correspond to the climate series in its entirety, or a portion of it.
QUALHYMO Parameters Affected by Date Formatting
Formula QUALHYMO Command Affected Parameters Value Units Start Date START IGYA A valid year code (e.g. 65) Year IGMA 01 - 12 Month IGDA 01 - 31 Day EXCEEDANCE IFYA A valid year code (e.g. 65) Year IFMA 01 - 12 Month IFDA 01 - 31 Day MAXMIN startYear A valid year (e.g. 1965) Year End Date START IGYB A valid year code (e.g. 97) Year IGMB 01 - 12 Month IGDB 01 - 31 Day EXCEEDANCE IFYB A valid year code (e.g. 97) Year IFMB 01 - 12 Month IFDB 01 - 31 Day MAXMIN endYear A valid year (e.g. 1997) Year -
- Start Date [Link]
-
Each date is entered as a single string, but for use in QUALHYMO needs to be broken down into three component numbers.
Startyear = Start Date [--/--/YYYY]
StartyearCode = Start Date [--/--/--YY]
Startmonth = Start Date [MM/--/----]
Startday = Start Date [--/DD/----]
-
-
- Drainage Area Calculations [Link]
-
Sub-sections:
Many of the parameters in several QUALHYMO commands are built from values that are assigned to several places within each drainage area. Each and every node on a drainage area will affect the nodes ‘above’ it. The Water Balance Model processes one node at a time, following each branch of the heirarchy until it terminates, then moving back down to the next unprocessed node.
Drainage Area Processing Diagram
The branches that make up a drainage area may terminate in either a surface condition or a source control.
QUALHYMO Parameters Affected by Drainage Area Calculations
Formula QUALHYMO Command Affected Parameters Value Units Size GENERATE DA Actual Hectares Imperviousness Ratio FRIMP > 0 and ≤ 1 Millimetres Initial Abstractions ABSIMP Real ≥ 0 Millimetres ABSPER Soil Moisture SMIN Real ≥ 0 Millimetres SMAX Real > 0 Millimetres -
- Size [Link]
-
The size of the model area for the project/scenario (node #1) on the processing diagram may be entered as either hectares, acres or Sq. Metres;. Each drainage area (if there are two due to the project type being set to watershed) has its size calculated separately. Use one of the following equations to calculate DA based on the selected units:
For hectares:
DrainageAreada = Project: Model Area * ( Drainage Area: Size (As a Percent) ÷ 100 ) * ScalingFactor
For acres:
DrainageAreada = Project: Model Area * ( Drainage Area: Size (As a Percent) ÷ 100 ) * ScalingFactor * 2.471
For metres²:
DrainageAreada = Project: Model Area * ( Drainage Area: Size (As a Percent) ÷ 100 ) * ScalingFactor * 10000
-
- Imperviousness Ratio [Link]
-
The FRIMP parameter reflects the ratio of impervious to pervious surfaces present in each drainage area. In the sample processing diagram, the nodes in a typical drainage area are shown. Correctly calculating a value for the FRIMP parameter requires stepping through each ‘level‚ and determing what affect the have, if any.
Surface Conditions Nodes
The formula is computed if a particular surface conditions node has a permeability soil property of impervious.
SurfCondFRIMPx = ( Drainage Area: Size (As a Percent) ÷ 100 ) * ( Native Soil Types: Size (As a Percent) ÷ 100 ) * ( Land Uses: Size (As a Percent) ÷ 100 ) * ( Surface Conditions: Size (As a Percent) ÷ 100 )
SurfCondFRIMPtotal = SurfCondFRIMP1 + SurfCondFRIMP2 + SurfCondFRIMP3 + …
Source Controls
As mitigation devices are added to a drainage area, the FRIMP may be modified to reflect the changed state of the drainage area; each source controls (surface enhancements or with storage) node with a permeability soil property of pervious (i.e. all of them, except for infiltration trenches) that is within an surface conditions node that is impervious will require the following calculation:
SourceConFRIMPx = ( Drainage Area: Size (As a Percent) ÷ 100 ) * ( Native Soil Types: Size (As a Percent) ÷ 100 ) * ( Land Uses: Size (As a Percent) ÷ 100 ) * ( Surface Conditions: Size (As a Percent) ÷ 100 )
SourceConFRIMPtotal = SourceConFRIMP1 + SourceConFRIMP2 + SourceConFRIMP3 + …
NOTE: ADD THE CHECK FOR FRIMP = 1 or FRIMP = 0
FRIMP
DrainageAreafrimp = SurfCondFRIMPtotal - SourceConFRIMPtotal
-
- Initial Abstractions [Link]
-
Sub-sections:
All surfaces (pervious and impervious) in each drainage area contribute to the initial abstraction values that are passed to the ABSIMP and ABSPER parameters. Processing the formulae for the initial abstractions follows the order in the processing diagram; the soil properties in both surface condions nodes and source control (both surface enhancements and with storage) nodes are referenced for values critical to the calculations.
-
- Surface Conditions Nodes [Link]
-
First, the size of the surface conditions node, relative to the drainage area, needs to be determined to weight its affect on the final value.
Size
SurfCondsize = ( Drainage Area: Size (As a Percent) ÷ 100 ) * ( Native Soil Types: Size (As a Percent) ÷ 100 ) * ( Land Uses: Size (As a Percent) ÷ 100 ) * ( Surface Conditions: Size (As a Percent) ÷ 100 )
With the size of the node determined the contribution to both the ABSIMP and ABSPER values is calculated.
ABSIMP
If the surface conditions node has a permeability soil property of impervious, it contributes to the ABSIMP of the drainage area.
SurfCondABSIMPx = SurfCondsize * Surface Conditions - Soil Properties: Depression Storage
ABSPER
Otherwise, if the surface conditions node has a permeability soil property of pervious, it contributes to the ABSIMP of the drainage area.
SurfCondABSPERx = SurfCondsize * Surface Conditions - Soil Properties: Depression Storage
Sum the Nodes
SurfCondABSIMPtotal = SurfCondABSIMP1 + SurfCondABSIMP2 + SurfCondABSIMP3 + …
SurfCondABSPERtotal = SurfCondABSPER1 + SurfCondABSPER2 + SurfCondABSPER3 + …
-
- Source Controls Nodes [Link]
-
Each source controls node that contains a soil definition property will contribute to the calculated ABSIMP and ABSPER values.
Source Controls - Surface Enhancement Nodes
Calculate the size of the source controls - surface enhancement node relative to the drainage area.
Size
SourceConsize = ( Drainage Area: Size (As a Percent) ÷ 100 ) * ( Native Soil Types: Size (As a Percent) ÷ 100 ) * ( Land Uses: Size (As a Percent) ÷ 100 ) * ( Surface Conditions: Size (As a Percent) ÷ 100 ) * ( Surface Area of Source Control - Surface Enhancements (As a Percent) ÷ 100 )
To properly reflect the replacement of any underlying surface condition soils, an amount of the existing ABSIMP or ABSPER must be ‘removed’.
ABSIMP Removed if the Surface Condition - Soil Properties: Permeability is Impervious
RemovedSurfEnABSIMPx = SourceConsize * Surface Conditions - Soil Properties: Depression Storage
ABSPER Removed if the Surface Condition - Soil Properties: Permeability is Pervious
RemovedSurfEnABSPERx = SourceConsize * Surface Conditions - Soil Properties: Depression Storage
Once the portion of the surface conditions node that is covered by the source controls - surface enhancement node has been computed, the new ABSPER values can be added in. ABSIMP is not included, as source control soils are always pervious.
ABSPER
SourceConSurfEnABSPERx = SourceConsize * Source Controls - Surface Enhancements - Soil Properties: Depression Storage
Sum the Nodes
RemovedSurfEnABSIMPtotal = RemovedSurfEnABSIMP1 + RemovedSurfEnABSIMP2 + RemovedSurfEnABSIMP3 + …
RemovedSurfEnABSPERtotal = RemovedSurfEnABSPER1 + RemovedSurfEnABSPER2 + RemovedSurfEnABSPER3 + …
SourceConSurfEnABSPERtotal = SourceConSurfEnABSPER1 + SourceConSurfEnABSPER2 + SourceConSurfEnABSPER3 + …
Source Controls - With Storage Nodes
Again, start by working out the size of the node.
Size
SourceConsize = ( Drainage Area: Size (As a Percent) ÷ 100 ) * ( Native Soil Types: Size (As a Percent) ÷ 100 ) * ( Land Uses: Size (As a Percent) ÷ 100 ) * ( Surface Conditions: Size (As a Percent) ÷ 100 ) * ( Surface Area of Source Control - With Storage (As a Percent) ÷ 100 )
Remove the soil properties of the overlapped surface condition soils.
ABSIMP Removed if the Surface Condition - Soil Properties: Permeability is Impervious
RemovedStorABSIMPx = SourceConsize * Surface Conditions - Soil Properties: Depression Storage
ABSPER Removed if the Surface Condition - Soil Properties: Permeability is Pervious
RemovedStorABSPERx = SourceConsize * Surface Conditions - Soil Properties: Depression Storage
Once the portion of the surface conditions node that is covered by the source controls - with storage node has been computed, the new ABSPER values can be added in. ABSIMP is not included, as source control soils are always pervious.
ABSPER
SourceConStorABSPERx = SourceConsize * Source Controls - With Storage - Soil Properties: Depression Storage
Sum the Nodes
RemovedStorABSIMPtotal = RemovedStorABSIMP1 + RemovedStorABSIMP2 + RemovedStorABSIMP3 + …
RemovedStorABSPERtotal = RemovedStorABSPER1 + RemovedStorABSPER2 + RemovedStorABSPER3 + …
SourceConStorABSPERtotal = SourceConStorABSPER1 + SourceConStorABSPER2 + SourceConStorABSPER3 + …
-
- Final Calculations [Link]
-
All of the per-node calculations are complete, now the total values are added together to work out a set of values for the ABSIMP and ABSPER parameters.
ABSIMP
DrainageAreaabsimp = ( SurfCondABSIMPtotal ) - ( RemovedSurfEnABSIMPtotal + RemovedStorABSIMPtotal )
Should the calculated ABSIMP value be less than 0.5 it must be adjusted with the following formula:
DrainageAreaabsimp = 0.5
ABSPER
DrainageAreaabsper = ( SurfCondABSPERtotal + SourceConSurfEnABSPERtotal + SourceConStorABSPERtotal ) - ( RemovedSurfEnABSPERtotal + RemovedStorABSPERtotal )
-
-
- Soil Moisture [Link]
-
Sub-sections:
These two parameters affect how a drainage area interacts with the moisture applied by the climate data. The wilting point, field capacity and depth of any soils present are used to work out the values of the parameters. Each drainage area in a project that is a watershed type has a separate SMIN and SMAX value.
-
- Native Soil Types Nodes [Link]
-
These formulae are computed once for each native soil type node in the drainage area. In the example diagram above, these are nodes #3 and #9.
Size
NativeSoilsize = ( Drainage Area: Size (As a Percent) ÷ 100 ) * ( Native Soil Types: Size (As a Percent) ÷ 100 )
Once the size of a native soil types node has been determined, it can contribute to the SMIN and SMAX of the drainage area (continuing the example from earlier, this is node #2) that they are a part of.
SMIN
NativeSoilSMINx = NativeSoilsize * ( ( Native Soil Types: Wilting Point ÷ 100 ) * Native Soil Types: Depth) )
SMAX
NativeSoilSMAXx = NativeSoilsize * ( ( Native Soil Types: Field Capacity ÷ 100 ) * Native Soil Types: Depth) )
Totals
NativeSoilSMINtotal = NativeSoilSMIN1 + NativeSoilSMIN2 + NativeSoilSMIN3 + …
NativeSoilSMAXtotal = NativeSoilSMAX1 + NativeSoilSMAX2 + NativeSoilSMAX3 + …
-
- Surface Conditions Nodes [Link]
-
As land uses nodes do not have any sort of soil definition or properties, the next nodes to be processed for calculating SMIN and SMAX are the surface conditions. Nodes #5, #7, #11 and #14 in the diagram are each processed in turn. The formula are very similar to what is used for the native soil types nodes, but with some additional values for determining the size of each node.
Unlike native soil types nodes, surface conditions nodes have the permeability attribute in their soil properties. Should it be set to ‘impervious’, the following equations are not computed for that particular node.
Size
SurfCondsize = ( Drainage Area: Size (As a Percent) ÷ 100 ) * ( Native Soil Types: Size (As a Percent) ÷ 100 ) * ( Land Uses: Size (As a Percent) ÷ 100 ) * ( Surface Conditions: Size (As a Percent) ÷ 100 )
SMIN
SurfCondSMINx = SurfCondsize * ( ( Surface Conditions: Wilting Point ÷ 100 ) * Surface Conditions: Depth )
SMAX
SurfCondSMAXx = SurfCondsize * ( ( Surface Conditions: Field Capacity ÷ 100 ) * Surface Conditions: Depth )
Totals
SurfCondSMINtotal = SurfCondSMIN1 + SurfCondSMIN2 + SurfCondSMIN3 + …
SurfCondSMAXtotal = SurfCondSMAX1 + SurfCondSMAX2 + SurfCondSMAX3 + …
-
- Source Controls Nodes [Link]
-
With the exception of infiltration trenches and underground source controls, some portion of the soil in the underlying surface condition node (with a permeability of pervious) will be replaced by the soil definition of the source controls node. Referring back to the processing diagram, it is shown that the soil defined in node #6 would replace some or all of the soil in node #5; #8 would do the same to #7, #12 to #11 and so on. The soils in native soil types nodes are never affected.
Source Controls - Surface Enhancement Nodes
As with the preceding native soil types and surface conditions nodes, each source controls - surface enhancemnts node is processed in turn. The sample diagram does not specify which which nodes (out of #6, #8, #12 and #15) are a source control - with storage, but in this case it does not alter the examples.
Special Cases
Source controls - surface enhancements nodes with a type of pervious paving or infiltration trench have some special instructions for processing. As an infiltration trench node does not have an associated soil definition property, it does not contribute to the SMIN and SMAX values calculated for the drainage area. The formula for calculating SMIN and SMAX from pervious paving nodes are listed separately (size calculations are unchanged).
Size
SourceConsize = ( Drainage Area: Size (As a Percent) ÷ 100 ) * ( Native Soil Types: Size (As a Percent) ÷ 100 ) * ( Land Uses: Size (As a Percent) ÷ 100 ) * ( Surface Conditions: Size (As a Percent) ÷ 100 ) * ( Surface Area of Source Control - Surface Enhancements (As a Percent) ÷ 100 )
Underlying Surface Condition Soil Removal
Before calculating how much of the total SMIN and SMAX to remove, first determine if the design soil rooting depth of the source controls node is less than or equal to the depth of the surface condition node.
SMIN Removed if Design Soil Rooting Depth ≥ Surface Condition: Depth
RemovedSurfSMINx = SourceConsize * ( ( Surface Conditions: Wilting Point ÷ 100 ) * Surface Conditions: Depth )
SMAX Removed if Design Soil Rooting Depth ≥ Surface Condition: Depth
RemovedSurfSMAXx = SourceConsize * ( ( Surface Conditions: Field Capacity ÷ 100 ) * Surface Conditions: Depth )
SMIN Removed if Design Soil Rooting Depth < Surface Condition: Depth
RemovedSurfSMINx = SourceConsize * ( ( Surface Conditions: Wilting Point ÷ 100 ) * Source Control - Surface Enhancements: Design Soil Rooting Depth )
SMAX Removed if Design Soil Rooting Depth < Surface Condition: Depth
RemovedSurfSMAXx = SourceConsize * ( ( Surface Conditions: Field Capacity ÷ 100 ) * Source Control - Surface Enhancements: Design Soil Rooting Depth )
Now, with the replaced soil removed, the soil definition can be factored in.
SMIN (Non-Pervious Paving)
SourceConSurfEnSMINx = SourceConsize * ( ( Source Control - Surface Enhancements: Wilting Point ÷ 100 ) * Source Control - Surface Enhancements: Design Soil Rooting Depth) )
SMIN (Pervious Paving)
SourceConSurfEnSMINx = 0
SMAX (Non-Pervious Paving)
SourceConSurfEnSMAXx = SourceConsize * ( ( Source Control - Surface Enhancements: Field Capacity ÷ 100 ) * Source Control - Surface Enhancements: Design Soil Rooting Depth ) )
SMAX (Pervious Paving)
SourceConSurfEnSMAXx = SourceConsize * ( ( Source Control - Surface Enhancements: Maximum Water Content ÷ 100 ) * Source Control - Surface Enhancements: Design Soil Rooting Depth ) )
Sum the Nodes
RemovedSurfSMINtotal = RemovedSurfSMIN1 + RemovedSurfSMIN2 + RemovedSurfSMIN3 + …
RemovedSurfSMAXtotal = RemovedSurfSMAX1 + RemovedSurfSMAX2 + RemovedSurfSMAX3 + …
SourceConSurfEnSMINtotal = SourceConSurfEnSMIN1 + SourceConSurfEnSMIN2 + SourceConSurfEnSMIN3 + …
SourceConSurfEnSMAXtotal = SourceConSurfEnSMAX1 + SourceConSurfEnSMAX2 + SourceConSurfEnSMAX3 + …
Source Controls - With Storage Nodes
As with the preceding native soil types and surface conditions nodes, each non-underground source controls - with storage node is processed in turn. The sample diagram does not specify which which nodes (out of #6, #8, #12 and #15) are a source control - with storage, but in this case it does not alter the examples.
Size
SourceConsize = ( Drainage Area: Size (As a Percent) ÷ 100 ) * ( Native Soil Types: Size (As a Percent) ÷ 100 ) * ( Land Uses: Size (As a Percent) ÷ 100 ) * ( Surface Conditions: Size (As a Percent) ÷ 100 ) * ( Surface Area of Source Control - With Storage (As a Percent) ÷ 100 )
Underlying Surface Condition Soil Removal
As with the source controls - surface enhancements nodes, any source control - with storage that has a soil definition will alter the underlying surface condition.
SMIN Removed if Design Soil Rooting Depth ≥ Surface Condition: Depth
RemovedStorSMINx = SourceConsize * ( ( Surface Conditions: Wilting Point ÷ 100 ) * Surface Conditions: Depth )
SMAX Removed if Design Soil Rooting Depth ≥ Surface Condition: Depth
RemovedStorSMAXx = SourceConsize * ( ( Surface Conditions: Field Capacity ÷ 100 ) * Surface Conditions: Depth )
SMIN Removed if Design Soil Rooting Depth < Surface Condition: Depth
RemovedStorSMINx = SourceConsize * ( ( Surface Conditions: Wilting Point ÷ 100 ) * Source Control - With Storage: Design Soil Rooting Depth )
SMAX Removed if Design Soil Rooting Depth < Surface Condition: Depth
RemovedStorSMAXx = SourceConsize * ( ( Surface Conditions: Field Capacity ÷ 100 ) * Source Control - With Storage: Design Soil Rooting Depth )
Now, with the replaced soil removed, the soil definition can be factored in.
SMIN
SourceConStorSMINx = SourceConsize * ( ( Source Control - With Storage: Wilting Point ÷ 100 ) * Design Soil Rooting Depth ) )
SMAX
SourceConStorSMAXx = SourceConsize * ( ( Source Control - With Storage: Field Capacity ÷ 100 ) * Design Soil Rooting Depth ) )
Sum the Nodes
RemovedStorSMINtotal = RemovedStorSMIN1 + RemovedStorSMIN2 + RemovedStorSMIN3 + …
RemovedStorSMAXtotal = RemovedStorSMAX1 + RemovedStorSMAX2 + RemovedStorSMAX3 + …
SourceConStorSMINtotal = SourceConStorSMIN1 + SourceConStorSMIN2 + SourceConStorSMIN3 + …
SourceConStorSMAXtotal = SourceConStorSMAX1 + SourceConStorSMAX2 + SourceConStorSMAX3 + …
-
- Final Calculations [Link]
-
In the preceding steps, a number of sums that represent each set of nodes contributions to the SMIN and SMAX parameters have been calculated; the only step remaining is to add them together (and remove the any replaced soils).
SMIN
DrainageAreasmin = ( NativeSoilSMINtotal + SurfCondSMINtotal + SourceConSurfEnSMINtotal + SourceConStorSMINtotal ) - ( RemovedSurfSMINtotal + RemovedSurfSMINtotal )
SMAX
DrainageAreasmax = ( NativeSoilSMAXtotal + SurfCondSMAXtotal + SourceConSurfEnSMAXtotal + SourceConStorSMAXtotal ) - ( RemovedSurfSMAXtotal + RemovedSurfSMAXtotal )
-
-
-
- Source Controls - With Storage Calculations [Link]
-
Sub-sections:
The process of simulating the storage functions provided by source controls - with storage requires several QUALHYMO commands.
QUALHYMO Parameters Affected by Source Controls - With Storage Calculations
Formula QUALHYMO Command Affected Parameters Value Units Volume Treated First SPLIT SERIES qinB > 0 qoutB > 0 Operated Outlet POND NPTSQB: Ba > 0 NPTSQB: Bb > 0 NPTSQB: Ca > 0 NPTSQB: Cb > 0 Overflow NPTSQV: Ba > 0 NPTSQV: Ca > 0 NPTSQV: Cb > 0 Pond Volume NPTSV: Ba > 0 NPTSV: Bb > 0 Pond Area NPTSA: Bb > 0 NPTSA: Ca > 0 NPTSA: Cb > 0 Losses to Ground Second SPLIT SERIES qinB > 0 qoutB > 0 qinC > 0 qoutC > 0 -
- Pre-processing [Link]
-
Sub-sections:
A number of values need to be pre-calculated for use in the formulae that prepare the values for a number of QUALHYMO parameters. For convenience, they have been organized here.
-
- Ponding Depth [Link]
-
Each source controls - with storage node (underground or above ground) on the drainage area may contribute to the PondingDepth value.
Above Ground Source Controls - With Storage
PondingDepthx = Source Controls - With Storage: Ponding Depth ÷ 1000
Underground Source Controls - With Storage
PondingDepthx = Source Controls - With Storage: Depth of Resevoir ÷ 1000
Total
PondingDepthtotal = PondingDepth1 + PondingDepth2 + PondingDepth3 + …
-
- Rooting Depth [Link]
-
Each source controls - with storage node (above ground only) on the drainage area may contribute to the RootingDepth value.
RootingDepthx = Source Controls - With Storage: Design Soil Rooting Depth ÷ 1000
Total
RootingDepthtotal = RootingDepth1 + RootingDepth2 + RootingDepth3 + …
-
- Baseflow Rate [Link]
-
Each source controls - with storage node (underground or above ground) on the drainage area may contribute to the BaseflowRate value.
BaseflowRatex = Applied Source Controls - With Storage: Absolute Discharge Rate (As a Volume)
Total
BaseflowRatetotal = BaseflowRate1 + BaseflowRate2 + BaseflowRate3 + …
-
- Operated Pipe Diameter [Link]
-
Each source controls - with storage node (above ground) on the drainage area may contribute to the OperatedPipeDiameter value.
OperatedPipeDiameterx = Applied Source Controls - With Storage: Baseflow Pipe Diameter
Total
OperatedPipeDiametertotal = OperatedPipeDiameter1 + OperatedPipeDiameter2 + OperatedPipeDiameter3 + …
-
- Infiltration Area [Link]
-
Each source controls - with storage node (underground or above ground) on the drainage area may contribute to the InfiltrationArea value. This value is required to be in Sq. Metres;, so a pre-calculation involving the project’s model area may be required.
Model Area is Hectares
ProjectArea = Project: Model Area * 10000
Model Area is Acres
ProjectArea = Project: Model Area * 4046
Model Area is Metres²
ProjectArea = Project: Model Area
Area
Next, the area of each node must be calculated.
InfiltrationAreax = ProjectArea * ( Drainage Area: Size (As a Percent) ÷ 100 ) * ( Native Soil Types: Size (As a Percent) ÷ 100 ) * ( Land Uses: Size (As a Percent) ÷ 100 ) * ( Surface Conditions: Size (As a Percent) ÷ 100 ) * ( Surface Area of Source Control - With Storage (As a Percent) ÷ 100 )
Total
InfiltrationAreatotal = InfiltrationArea1 + InfiltrationArea2 + InfiltrationArea3 + …
-
- Infiltration Rate [Link]
-
Each source controls - with storage node (underground or above ground) on the drainage area may contribute to the InfiltrationRate value. Several formula are required to compute this value. The area of each source controls - with storage node in Sq. Metres; is required, so a pre-calculation involving the project’s model area may be required.
Model Area is Hectares
ProjectArea = Project: Model Area * 10000
Model Area is Acres
ProjectArea = Project: Model Area * 4046
Model Area is Sq. Metres;
ProjectArea = Project: Model Area
Next, each node its area and then portion of the InfiltrationRate may be calculated in turn.
Area and Infiltration Rate per Source Controls - With Storage Node
SourceConStorSizex = ProjectArea * ( Drainage Area: Size (As a Percent) ÷ 100 ) * ( Native Soil Types: Size (As a Percent) ÷ 100 ) * ( Land Uses: Size (As a Percent) ÷ 100 ) * ( Surface Conditions: Size (As a Percent) ÷ 100 ) * ( Surface Area of Source Control - With Storage (As a Percent) ÷ 100 )
InfiltrationRatex = ( SourceConStorSizex ÷ InfiltrationAreatotal ) * Source Controls - With Storage: Infiltration Rate (Per Hour)
Total
InfiltrationRatetotal = InfiltrationRate1 + InfiltrationRate2 + InfiltrationRate3 + …
-
- Porosity [Link]
-
Each source controls - with storage node (underground or above ground) on the drainage area may contribute to the Porosity value.
Porosityx = ( Source Control - With Storage: Average Voidspace Ratio ÷ 100 ) * ( Drainage Area: Size (As a Percent) ÷ 100 ) * ( Native Soil Types: Size (As a Percent) ÷ 100 ) * ( Land Uses: Size (As a Percent) ÷ 100 ) * ( Surface Conditions: Size (As a Percent) ÷ 100 ) * ( Surface Area of Source Control - With Storage (As a Percent) ÷ 100 )
Total
Porositytotal = Porosity1 + Porosity2 + Porosity3 + …
-
-
- Volume Treated [Link]
-
The qinB and qoutB parameters describe the proportion of moisture that is treated by the storage features of source controls - with storage.
Size of Treated Area
A certain percentage of the drainage area is treated; this is derived from both the area of any source controls - with storage nodes, and the area of any connected treatment area nodes. Each node must be processed to determine the size of the treated area relative to the size of the drainage area.
Size of Source Controls - With Storage Nodes
SourceConStorSizex = ( Drainage Area: Size (As a Percent) ÷ 100 ) * ( Native Soil Types: Size (As a Percent) ÷ 100 ) * ( Land Uses: Size (As a Percent) ÷ 100 ) * ( Surface Conditions: Size (As a Percent) ÷ 100 ) * ( Surface Area of Source Control - With Storage (As a Percent) ÷ 100 )
Size of Connected Treatment Areas Nodes
ConnTreatSizex = ( Drainage Area: Size (As a Percent) ÷ 100 ) * ( Native Soil Types: Size (As a Percent) ÷ 100 ) * ( Land Uses: Size (As a Percent) ÷ 100 ) * ( Surface Conditions: Size (As a Percent) ÷ 100 ) * ( Connected Treatment Areas: Size (As a Percent) ÷ 100 )
Sum the Nodes
SourceConStorSizetotal = SourceConStorSize1 + SourceConStorSize2 + SourceConStorSize3 + …
ConnTreatSizetotal = ConnTreatSize1 + ConnTreatSize2 + ConnTreatSize3 + …
TreatedSize = SourceConStorSizetotal + ConnTreatSizetotal
Volume Points
The qinB and qoutB parameters compliment the qinA and qoutA parameters to draw a simple graph that controls the volume of moisture that enters the storage facilities of the source controls - with storage present in the drainage area.
qinB
SourceControlSplitqinb = MaximumDischarge
qoutB
SourceControlSplitqoutb = TreatedSize * MaximumDischarge
-
- Operated Outlet [Link]
-
With all of the pre-processing completed, the set of values for the operated outlet may be calculated. First, work out the discharge rate for the drainage area.
Discharge Rate
DischargeRate = ScalingFactor * ( InfiltrationAreatotal * ( InfiltrationRatetotal ÷ 3600000 ) )
Now, one of two methods may be used to calculate the operated outlet values.
Baseflow Pipe Diameter Available
If available, the baseflow pipe diameters of the source controls - with storage nodes applied to the drainage area may be used to calculate the operated outlet values for the POND command.
Ba
SourceControlPondOperatedOutflowba = Depth ÷ 2
Bb
SourceControlPondOperatedOutflowbb = DischargeRate + ( ScalingFactor * ( BaseflowRatetotal + 2.589 * ( √ ( Depth ÷ 2 * ( 0.785 * OperatedPipeDiametertotal² ) ) ) ) )
Ca
SourceControlPondOperatedOutflowca = Depth
Cb
SourceControlPondOperatedOutflowcb = DischargeRate + ( ScalingFactor * ( BaseflowRatetotal + 2.589 * ( √ ( Depth * ( 0.785 * OperatedPipeDiametertotal² ) ) ) ) )
Absolute Discharge Rate
In the absence of baseflow pipe diameter values, the absolute discharge rate may be used instead.
Ba
SourceControlPondOperatedOutflowba = Depth ÷ 2
Bb
SourceControlPondOperatedOutflowbb = DischargeRate + ( ScalingFactor * BaseflowRatetotal )
Ca
SourceControlPondOperatedOutflowca = Depth
Cb
SourceControlPondOperatedOutflowcb = DischargeRate + ( ScalingFactor * BaseflowRatetotal )
-
- Overflow [Link]
-
Calculations for the overflow values are based on the values that have been pre-processed.
Ba
SourceControlPondOverflowba = Depth - OverflowPipeDiameter
Ca
SourceControlPondOverflowca = Depth
CB
SourceControlPondOverflowcb = ScalingFactor * ( 3.2 * OverflowPipeDiameter2.5 )
-
- Pond Volume [Link]
-
Calculations for the pond volume values are based on the values that have been pre-processed.
Ba
SourceControlPondVolumeba = Depth
Bb
SourceControlPondVolumebb = ( InfiltrationAreatotal * Porositytotal * RootingDepthtotal ) + ( InfiltrationAreatotal * PondingDepthtotal )
-
- Pond Area [Link]
-
Calculations for the pond area values are based on the values that have been pre-processed.
Bb
SourceControlPondAreabb = InfiltrationAreatotal - 0.0001
Ca
SourceControlPondAreaca = Depth
Cb
SourceControlPondAreacb = InfiltrationAreatotal
-
- Losses to Ground [Link]
-
First, the discharge rate must be calculated from values that have been pre-processed.
Discharge Rate
DischargeRate = ScalingFactor * ( InfiltrationAreatotal * ( InfiltrationRatetotal ÷ 3600000 ) )
Now the values that will be used in the QUALHYMO SPLIT SERIES command's parameters can be worked out.
qinB
SourceControlLossesqinb = DischargeRate * 0.99
qoutB
SourceControlLossesqoutb = DischargeRate * 0.01
qinC
SourceControlLossesqinc = DischargeRate * ( DischargeRate + 2 )
qoutC
SourceControlLossesqoutc = DischargeRate
-
-
- Off-Site Storage Calculations [Link]
-
Sub-sections:
Despite using the same QUALHYMO POND command as the source controls - with storage calculations, correctly modeling the off-site storage system in scenario requires a new set of values.
QUALHYMO Parameters Affected by Source Controls - With Storage Calculations
Formula QUALHYMO Command Affected Parameters Value Units Operated Outlet POND NPTSQB: Ba > 0 NPTSQB: Bb > 0 NPTSQB: Ca > 0 NPTSQB: Cb > 0 Overflow NPTSQV: Ba > 0 NPTSQV: Ca > 0 NPTSQV: Cb > 0 Pond Volume NPTSV: Ba > 0 NPTSV: Bb > 0 Pond Area NPTSA: Ab > 0 NPTSA: Ba > 0 NPTSA: Bb > 0 -
- Operated Outlet [Link]
-
The first two of four QUALHYMO POND command parameters are calculated in a consistent manner, regardless of whether the discharge rates is used as entered, or calculated from the pipe diameter.
Ba
OffSiteOperatedOutflowba = Off-Site Storage Volume: Pond Depth ÷ 2
Ca
OffSiteOperatedOutflowca = Off-Site Storage Volume: Pond Depth
Use Entered Discharge Rate
If the discharge rate has been entered, the following two equations are all that is required.
Bb
OffSiteOperatedOutflowbb = ScalingFactor * ( Off-Site Storage: Watershed Discharge Rate (As a Volume) ÷ 2 )
Cb
OffSiteOperatedOutflowcb = ScalingFactor * Off-Site Storage: Watershed Discharge Rate (As a Volume)
Use Calculated Discharge Rate
In the absence of an existing discharge rate, the discharge pipe diameter is used instead.
DischargePipe = Off-Site Storage: Discharge Pipe Diameter ÷ 1000
Bb
OffSiteOperatedOutflowbb = ScalingFactor * ( 2.589 * ( √ ( Off-Site Storage Volume: Pond Depth ÷ 2 * ( 0.785 * DischargePipe² ) ) ) )
Bb
OffSiteOperatedOutflowbb = ScalingFactor * ( 2.589 * ( √ ( Off-Site Storage Volume: Pond Depth * ( 0.785 * DischargePipe² ) ) ) )
-
- Overflow [Link]
-
Entry of the discharge rate for off-site storage may be done either by entering the discharge rate directly, or calculating it from the entered pipe diameters.
Overflow Pipe Diameter Check
If a diameter for the overflow pipe has not been specified, a value is substituted to allow completion of further calculations.
OverflowPipe = 0.5
Otherwise, the overflow pipe diameter is used as entered.
OverflowPipe = Off-Site Storage: Overflow Pipe Diameter ÷ 1000
Ba
OffSiteOverflowba = Off-Site Storage Volume: Pond Depth - OverflowPipe
Ca
OffSiteOverflowca = Off-Site Storage Volume: Pond Depth
Cb
OffSiteOverflowcb = ScalingFactor * ( 3.2 * OverflowPipe2.5 )
-
- Pond Volume [Link]
-
Calculations for the pond volume values are based on the values that have been pre-processed.
Ba
OffSitePondVolumeba = Off-Site Storage Volume: Pond Depth
Bb
OffSitePondVolumebb = Off-Site Storage Volume: Pond Depth * ( ( ( ScalingFactor * Off-Site Storage Volume: Area of Pond Surface ) + ( ScalingFactor * Off-Site Storage Volume: Area of Pond Floor ) ) ÷ 2 )
-
- Pond Area [Link]
-
Calculations for the pond area values are straightforward and based on the values entered.
Ab
OffSitePondAreaab = ScalingFactor * Off-Site Storage Volume: Area of Pond Floor
Ba
OffSitePondAreaba = Off-Site Storage Volume: Pond Depth
Bb
OffSitePondAreabb = ScalingFactor * Off-Site Storage Volume: Area of Pond Surface
-
-
- Output Calculations [Link]
-
Sub-sections:
Processing the base case scenario's output yields a number of values that are required to calculate certain formulae in the Water Balance Model.
QUALHYMO Parameters Affected by Output Calculations
Formula QUALHYMO Command Affected Parameters Value Units Exceedance Intervals EXCEEDANCE EXEB > 0 EXEC > 0 EXED > 0 EXEE > 0 EXEF > 0 EXEG > 0 EXEH > 0 EXEI > 0 EXEJ > 0 -
- Maximum Discharge [Link]
-
The base case scenario generates a maximum discharge rate that is used in several places when modeling post-development mitigation scenarios. There are no mathematical calculations involved, instead the value is pulled from the output file generated by QUALHYMO in the ANNUAL MAXIMUMS block.
 ============ ANNUAL MAXIMUMS ===========
            DATE    FLOW RATE
                    (CMS)
            1965    0.76963E+02
            1966    0.48743E+02
            1967    0.11817E+03
            1968    0.75084E+02
            1969    0.39737E+02
            1970    0.80466E+02
            1971    0.51688E+02
            1972    0.12695E+03
            1973    0.60564E+02
            1974    0.97568E+02
            1975    0.96338E+02
            1976    0.56148E+02
The highest value from the FLOW RATE column is used, and converted from notation to decimal. Based on the sample values above, the following value would be used:
MaximumDischarge = 126.95
-
- Exceedance Intervals [Link]
-
For graphing and processing purposes, the Water Balance Model requires a set of exceedance interval values. These values are generated from the base case scenario.
Exceedanceb = ( MaximumDischarge ÷ 9 )
Exceedancec = ( MaximumDischarge ÷ 9 ) * 2
Exceedanced = ( MaximumDischarge ÷ 9 ) * 3
Exceedancee = ( MaximumDischarge ÷ 9 ) * 4
Exceedancef = ( MaximumDischarge ÷ 9 ) * 5
Exceedanceg = ( MaximumDischarge ÷ 9 ) * 6
Exceedanceh = ( MaximumDischarge ÷ 9 ) * 7
Exceedancei = ( MaximumDischarge ÷ 9 ) * 8
Exceedancej = MaximumDischarge
-
-
-
- Climate Data [Link]
-
Sub-sections:
-
- Preamble [Link]
-
A series of historical climate data is referenced to provide regional variation and climatic trends. Official climate and weather observations for Canada data is provided by Environment Canada, National Climate Data and Information Archive (NCDIA), formerly known as the Atmospheric Environment Services (AES).
-
- Climate and Weather Service [Link]
-
The archive consists of a database of monthly, daily and hourly weather observations, including temperature, precipitation, air pressure, wind speed, and cloud types, as well as notes on the occurrence of thunderstorms, hail, fog and other types of weather. Most of this collection is now available to the public through the new web site Climate Data Online which provides live access to basic historical climate & Wx data from the National Climate Archive.
-
- Network Description [Link]
-
The Atmospheric Environment Service First Order Network dates, mainly, from the period near World War II. It was initiated to provide synoptic data in real-time for weather forecasting and to support commercial airlines, general and military aviation.
The current national network of surface weather observations has evolved in accordance with the World Meteorological Organization. These records of Canada's ever-changing weather have proved invaluable to a wide variety of specialists, including weather forecasters, emergency planners and weather-dependent businesses and industry.
-
- Data Details [Link]
-
The quality controlled data are stored in the AES standard data formats. Archived data are stored in standard AES format files.
Access to selected portions of this data, as well as related products such as CD-ROMs and climate normals and averages are available by agency request or for download at Climate Data Online. Information regarding obtaining extremes, monthly summaries, microfilm, microfiche, paper documents and technical documents, is also available.
-
- Quality Assurance Program [Link]
-
At manned stations, the observers check the instruments daily. Inspectors from the Regional Office inspect the stations regularly. Automated stations are inspected and serviced routinely by Regional Office inspectors. The data are monitored hourly by observers, briefers and forecasters; gross inaccuracies are reported to inspection staff. Hourly data are quality- controlled by an automated process.
Routine inspection and maintenance visits are made to the sites.
-
- Standards [Link]
-
In general, World Meteorological Organization standards for siting, observing protocols and data storage are employed. The details of the Atmospheric Environment Service AES standards are found in the publication, “AES Guidelines for Co-operative Climatological Stations”, Version 2.0, Guide 92-1, October 1992.
-
- Contact [Link]
-
National Climate Data and Information Archive (National)
Fax: (416) 739-4446
Climate.Services@ec.gc.caSee National Climate Data and Information Archive for more details.
-
- Water Balance Model Climate Data Sets [Link]
-
The WBM utilizes 3 of these elements, evaporation, precipitation and temperature. This data is stored in the form of 3 regionally specific flat data files suffixed by the extensions .EVA, .PRE, .TPT respectively. The regions provided include:
-
Abbotsford
-
Calgary
-
Comox
-
Edmonton
-
Halifax
-
Kamloops
-
Kelowna
-
Kwatlen
-
Langley
-
North Vancouver
-
Ottawa
-
Surrey
-
Toronto
-
Vancouver
-
Victoria
-
White Rock
-
Winnipeg
Each of these flat file contains tab separated values detailing historical data for the region defined. The schema of this data varies according to the element it details.
Standard record formats have been adopted for climatological data which are archived at hourly, daily or monthly intervals. Each record consists of date followed by the data repeated for each time interval. The units and decimal position are implied by the assigned element number.
Additional record details are available from NCDIA
Evaporation
Evaporation is reported in months for each year from 1911 to 1998.
Monthly Record of Data - | YEAR | MONTH | VALUE |
Units are millimetres.
Evaporation Sample
Year  Jan   Feb   Mar   Apr    May    Jun     Jul     Aug     Sept    Oct    Nov   Dec
	1911  0.00  0.00  0.00  41.50  97.70  159.00  178.00  146.50  103.60  52.00  0.00  0.00
	1912  0.00  0.00  0.00  48.60  145.30 184.60  159.70  137.40  95.00   49.60  0.00  0.00
	1913  0.00  0.00  0.00  56.80  117.90 128.80  175.80  140.00  93.40   46.10  0.00  0.00
	1914  0.00  0.00  0.00  43.90  123.90 143.10  174.10  159.50  107.10  45.40  0.00  0.00
	1915  0.00  0.00  0.00  61.90  99.50  115.80  136.70  151.20  103.90  56.60  0.00  0.00
	1916  0.00  0.00  0.00  ...
Precipitation
Precipitation is reported by year, month and day in 24 hour intervals from 1959 to 1998.
Daily Record of Data - | YEAR | MONTH | HOUR | VALUE |
Units are centimetres.
Precipitation Sample
YR/M/D
	591231      0  0  0  0  0  0  0  0  0  0  0  0  0  0  0  0  0  0  0  0  0  0  0  0
	60 1 1      0  0  0  0  0  0  0  0  0  0  0  0  0  0  0  0  0  0  0  0  0  0  0  0
	60 1 2      2  1  1  1  1  1  1  1  1  1  1  1  1  1  1  1  1  1  1  1  1  1  1  1
	60 1 3      3  3  3  3  3  3  3  3  2  2  2  2  2  2  2  2  2  2  2  2  2  2  2  2
	60 1 4      2  2  2  2  2  2  2  2  2  2  2  2  2  2  1  1  1  1  1  1  1  1  1  1
	60 1 5      0  0  0  0  0  0  0  0  0  0  0  0  0  0  0  0  0  ...
Temperature
Temperature is reported by year, month and day in 24 hour intervals from 1959 to 1998.
Daily Record of Data - | YEAR | MONTH | HOUR | VALUE |
Units are degrees celcius.
Temperature Sample
YR/M/D
	591231  -133 -128 -122 -122 -133 -133 -133 -139 -139 -156 -144 -144 -139 -139 -144 -144 -150 -161 -156 -178 -172 -178 -161 -172
	60 1 1  -133 -128 -122 -122 -133 -133 -133 -139 -139 -156 -144 -144 -139 -139 -144 -144 -150 -161 -156 -178 -172 -178 -161 -172
	60 1 2  -156 -156 -122 -117 -133 -117 -089 -094 -089 -094 -094 -117 -128 -128 -133 -133 -144 -156 -161 -161 -167 -172 -172 -189
	60 1 3  -200 -183 -206 -228 -228 -228 ...
-
-
-
-
User Information and Requirements [Link]
-
- User Levels [Link]
-
The British Columbia Inter-Governmental Partnership has identified three categories of model users, each with a different degree of access to the various features of the Water Balance Model powered by QUALHYMO:
General User:
Has limited access and no flexibility to customize, and will be restricted to default values for input parameters, including climate data.
Paying Subscriber:
Any individual, company or group that pays an annual "fee for service" will have password-protected access that provides some flexibility to customize values for some input parameters. (A Paying Subscriber will be able to access the soils and land use databases for all provincial partners.)
Project Partner:
Has password-protected access and total flexibility to customize the database for input parameters.
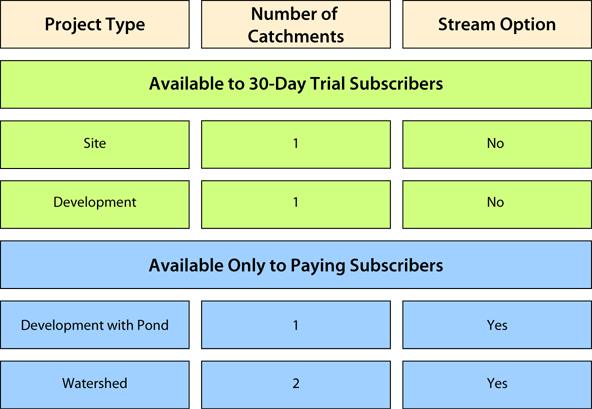
-
- Application Requirements [Link]
-
As an online planning and decision support tool, the application is web-based and does not require any implementation or set-up of application files onto a computer. Users access the model using a modern web-browser such as Microsoft Internet Explorer 6.0 or higher, Mozilla Firefox 2.0 or higher, or any other Web browser compatible with these browsers. Use of the Water Balance Model requires the Web browser to support the Flash Player version 9 or later. By default, most major Web browsers are configured to handle this requirement.
The Water Balance Model application is a combination of PHP, XML, CSS, and Flash technologies with a variety of input and climate data files in an ascii text file format, as well as various supporting files such as image icons. Files are hosted on a Web Server running Microsoft IIS (Internet Information Services), a Web platform used in developing and hosting Web applications and Web services, with data processing handled by PHP, a server-side scripting language. Microsoft SQL Server, a database application for storing and delivering data, is used for file storage. Scenario processing is performed by the QUALHYMO hydrologic simulation engine. For more information on the application requirements of QUALHYMO, see the QUALHYMO User Manual.
There is a default structure for the files required to run the Water Balance Model described by the listing below. By default, the main application structure starts from a top-level folder (\Version Number). Subdirectories that contains other application and associated files are listed below.
Directory Description \\VersionNumber root application folder \Data contains Datasource directory \Datasource contains application references to climate data files \Interface contains a set of application and data files in .js, .php, .swf, .html, and .xml format used to generate and control the User Interface \Assets a set of image files in .png, and .swf format used to display the User Interface \Data contains application references of acceptable values used for error checking input values used for generating scenarios \Datasource contains references to default regional values data files used for generating scenarios \PHP additional application files for data management and xml data translations for interface values \Processing a set of application and data files in .php, .xsl, and .xml format used to run the Water Balance Model. This is the location of the QUALHYMO executable file that performs all hydrological calculations \Data a set of regional climate data files in EVA (evaporation), PRE (precipitation),and TPT (temperature) files for modeling scenarios \Debug contains application files used to debug input and output files \Scenarios contains generated QUALHYMO text files for input and output \Sites contains application files for modeling sites from user inputs
-
-
References [Link]
-
Glossary [Link]
Terms:
- Absorbent Landscape,
- Base Case,
- Baseflow,
- Bio-filtration Swales,
- Connected Treatment Areas,
- Drainage Area,
- Drainage Area – Modelled Area,
- Drainage Area – Surrounding Watershed,
- Field Capacity,
- Green Roofs,
- Infiltration Swales,
- Infiltration Galleries,
- Land Uses,
- Maximum Exceedance,
- Native Soil Types,
- Off-Site Storage,
- Pervious Paving,
- QUALHYMO,
- Rain Gardens,
- Retention Ponds,
- Source Controls,
- Source Controls – Surface Enhancements,
- Source Controls – With Storage,
- Surface Condition,
- Time of Concentration,
- Wilting Point
- Absorbent Landscape [Link]
A landscape area that acts like a sponge to soak up, store and slowly release rainfall in order to avoid conditions that would cause reduced infiltration at the surface.
- Base Case [Link]
A projection of how the existing hydrologic system would react with current physical and climatic condition and trends continuing. This may also be describe a 'pre-development' state. In practical terms, the following parameters of a project can only be set in the base case scenario:
- Baseflow [Link]
The portion of stream flow that is not runoff and results from seepage of water from the ground into a channel over time.
- Bio-filtration Swales [Link]
See Infiltration Swales.
- Connected Treatment Areas [Link]
A collection of defined separate but connected areas with source control that are able to accept runoff.
- Drainage Area [Link]
The drainage area that the user wishes to model. It can be as small as a single lot or site, it can encompass a larger development, or it can represent a watershed.
- Drainage Area – Modelled Area [Link]
Site and Development projects contain a single Drainage Area, referred to as the Modelled Area.
- Drainage Area – Surrounding Watershed [Link]
Watersheds are comprised of the Modelled Area, and a second Drainage Area that typically represents the areas outside of the modeller's interest.
- Field Capacity [Link]
A measurement of water content held in soil once all excess and surface water has been drained from the area. Determining field capacity provides an estimate of how much moisture the soil can retain while still remaining viable for planting or as a site for constructions.
- Green Roofs [Link]
A conventional roof with a veneer of growing media that supports living vegetation underlain by a drainage layer. Green roofs are an effective means of managing runoff from rooftops as the drainage layer retains rainfall, attenuates peak runoff rates and allows it evaporate or transpire from the rooftop vegetation.
- Infiltration Swales [Link]
A shallow open grassed channel, accepting flows from small areas of adjacent paved surfaces. The swale is designed to infiltrate the flow slowly through a soil bed to an underlying drain rock reservoir.
- Infiltration Galleries [Link]
A structure used to supplement a storm sewer, by directing storm runoff from impervious urban areas to groundwater through permeable soils.
- Land Uses [Link]
The designated type of built environment modification the local municipality, generally through by-laws and zoning standards, uses to describe zone within their jurisdiction.
- Maximum Exceedance [Link]
Maximum rate of flow measured for an area. The exceedance is only the rate of flow in excess of the allowed design peak to average flow ratio.
- Native Soil Types [Link]
Native soils are used to describe the surface soils that, in their natural location and condition, have been modified by weathering and have an accumulation of some organic matter. These can be very shallow or very deep and have regular exposure to water.
- Off-Site Storage [Link]
A remote runoff storage facility in the form of detention ponds that function to limit discharges to downstream drainage systems or streams.
- Pervious Paving [Link]
Pervious paving is a surface layer of paving systems which allows rainfall to percolate into an underlying reservoir where runoff is stored and either exfiltrated to underlying subgrade, or removed by a subdrain.
- QUALHYMO [Link]
The QUALHYMO (QUALity HYdrologic MOdel) is a hydrologic simulation engine developed in the early 1980s by Dr. Charles Rowney for the Ontario Ministry of Environment. QUALHYMO is based on a continuous simulation methodology that includes rainfall/runoff and snowmelt analysis processes. It is made up of a set of user invoked commands that can be applied to control a modeled flow, represent physical components or provide diagnostic information such as statistics on flow rate, concentration, or depth.
- Rain Gardens [Link]
A planted depression that allows rainwater runoff from roofs or paving is allowed to pond temporarily while infiltrating into deeply constructed soils below.
- Retention Ponds [Link]
A permanent pool of water with vegetation around the perimeter used to manage storm water runoff to prevent flooding and downstream erosion.
- Source Controls [Link]
Source controls are practices used to reduce runoff from impervious surfaces on development sites and roads. Source controls capture rainfall at the source and return it to natural hydrologic pathways or re-use it at the source They include practices such as absorbent landscaping, infiltration facilities, green roofs, rainwater re-use.
- Source Controls – Surface Enhancements [Link]
Practices for runoff control facilities that different physical conditions of the permeable portions of the project area for runoff volume reduction. Several volume reduction methods consist of augmented or enhanced surface conditions that include: increased top soil depth, soil porosity or moisture holding capacity, surface infiltration rates, vegetation and ground cover and pervious paving.
- Source Controls – With Storage [Link]
Practices for runoff control facilities that provide discharge control or reduce surface runoff volumes and come into play after the Surface Enhancements are filled and producing surface runoff. These systems typically include a storage volume and can include infiltration to ground that will be in addition to the surface infiltration for the catchment. Source controls with storage include infiltration galleries, rain gardens, retention ponds, some forms of green roof and bio-filtration swales.
- Surface Condition [Link]
A description of the physical characteristics of the study areas surface. Basically this means the proportions of impervious versus pervious areas.
- Time of Concentration [Link]
It is defined as the time needed for water to flow from the most remote point in a watershed to the watershed outlet or point of interest. It is a function of the topography, geology, and land use within the watershed and is used to measure the response of a watershed to a rain event.
-
Index [Link]
- Introduction
- About the Manual
-
Data Inputs
- Water Balance Model powered by QUALHYMO
- Mapping the Relationship Between the Interface and the Data
- Variable Relationship Mapping
- Projects & Scenarios
- Configure Drainage Area
- Design Source Controls - Surface Enhancements
- Design Source Controls - With Storage
- Apply Source Controls
- Configure Off-Site Storage
- Configure Stream
- Soil Properties
- Mapping Data to QUALHYMO
- Graphic Outputs
-
Equation and Data Reference
- Preamble
- Examples
- Data Input Equations
- QUALHYMO Parameter Equations
- Climate Data
- User Information and Requirements
- References
- Glossary
- Index
Table of Contents
- Introduction
- About the Manual
-
Data Inputs
- Water Balance Model powered by QUALHYMO
- Mapping the Relationship Between the Interface and the Data
- Variable Relationship Mapping
- Projects & Scenarios
- Configure Drainage Area
- Design Source Controls - Surface Enhancements
- Design Source Controls - With Storage
- Apply Source Controls
- Configure Off-Site Storage
- Configure Stream
- Soil Properties
- Mapping Data to QUALHYMO
- Graphic Outputs
- Equation and Data Reference
- User Information and Requirements
- References
- Glossary
- Index